Published: 2026-03-23T05:32:04.000Z
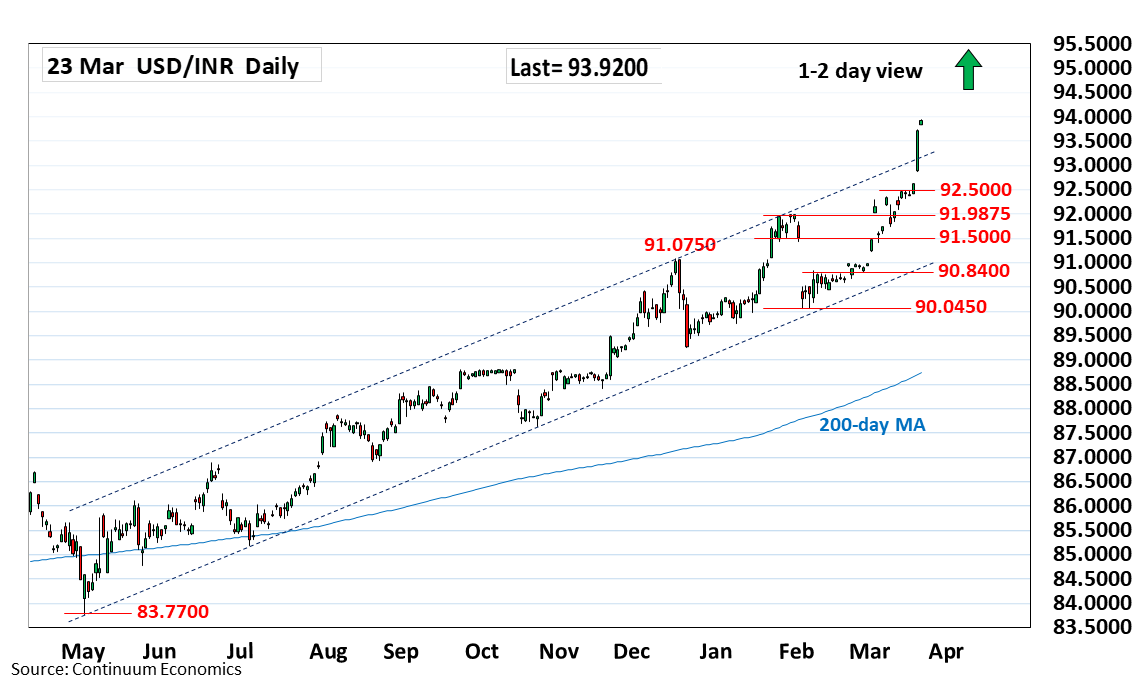
Chart USD/INR Update: Extend parabolic rally to fresh record high
-
Sharply higher as prices extend sharp rally to post fresh record high at 93.9400
| Level | Comment | Level | Comment | |||||
|---|---|---|---|---|---|---|---|---|
| R4 | 95.0000 | * | figure | S1 | 93.0000 | figure | ||
| R3 | 94.9900 | * | projection | S2 | 92.8800 | * | 20 Mar low | |
| R2 | 94.5000 | * | projection | S3 | 92.5000 | * | congestion | |
| R1 | 94.0000 | * | figure | S4 | 92.4750 | * | 13 Mar high |
Asterisk denotes strength of level
05:30 GMT - Sharply higher as prices extend break above the 92.4750/92.5000, 13 March high and congestion area, to post fresh record high at 93.9400. Nearby see scope to target the 94.0000 figure. Bullish momentum keeps pressure on the upside and further gains cannot be ruled out to 94.50 projection. Parabolic gains see prices deep into overbought areas and caution corrective pullback. Meanwhile, support is raised to the 93.0000/92.8800 congestion and 20 March low which should underpin. Below this will open up room to 92.5000/92.4750 area.