Chart USD/SGD Update: Balanced at critical support
Anticipated losses are giving way to consolidation above critical support at the 1.2586 current year low of 28 January and congestion around 1.2600
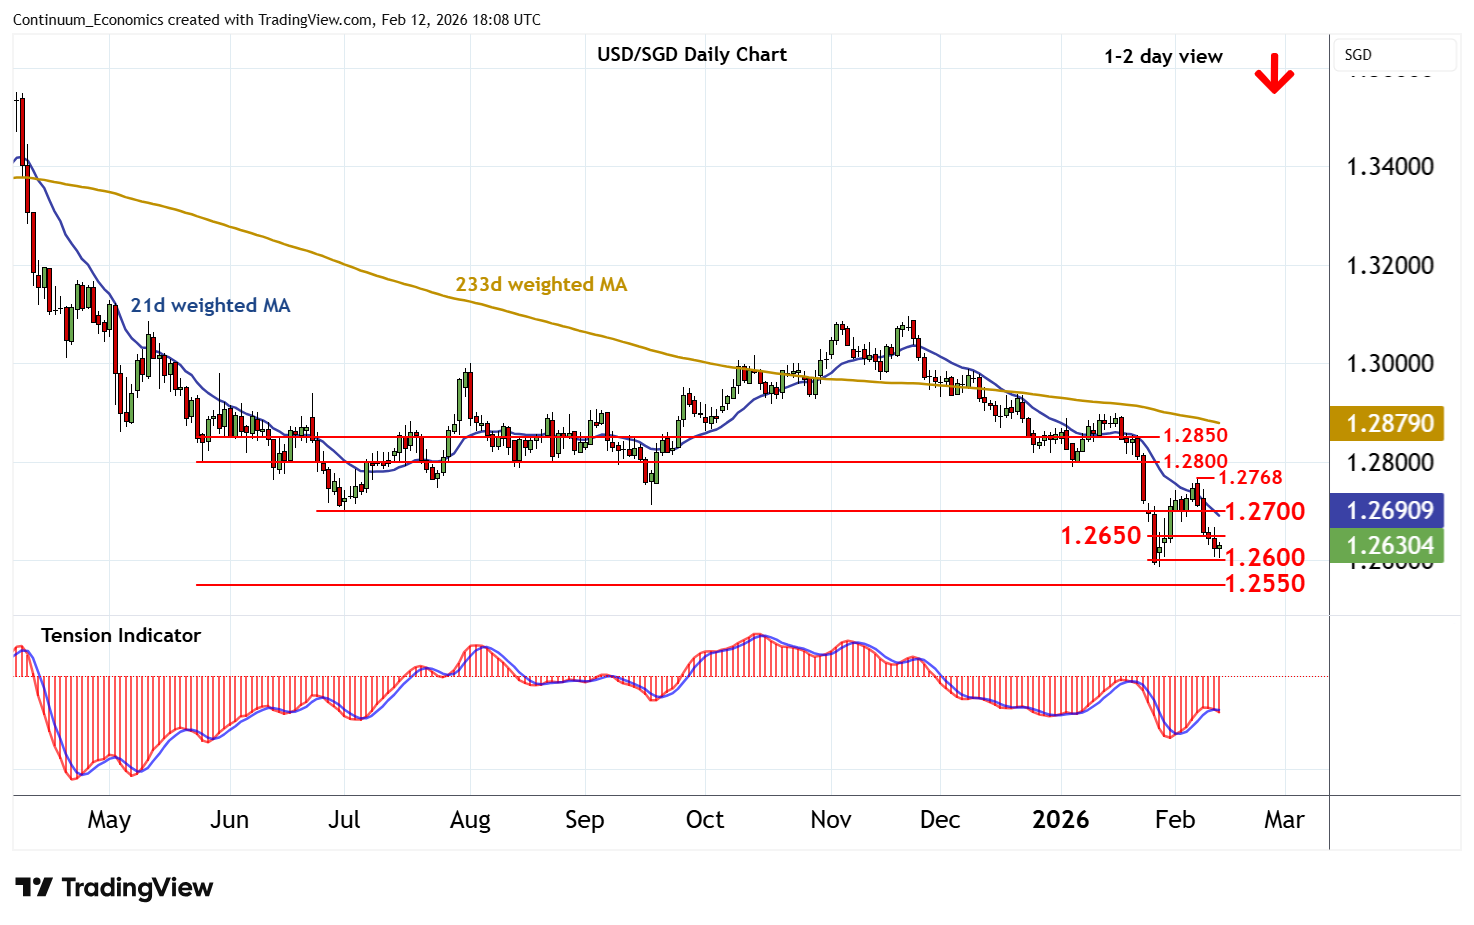
| Level | Comment | Level | Comment | ||||
|---|---|---|---|---|---|---|---|
| R4 | 1.2800 | * | congestion | S1 | 1.2600 | * | congestion |
| R3 | 1.2768 | ** | 6 Feb (w) high | S2 | 1.2586 | ** | 28 Jan YTD low |
| R2 | 1.2700 | ** | break level | S3 | 1.2550 | * | congestion |
| R1 | 1.2650 | * | congestion | S4 | 1.2435 | * | August 2014 low |
Asterisk denotes strength of level
18:00 GMT - Anticipated losses are giving way to consolidation above critical support at the 1.2586 current year low of 28 January and congestion around 1.2600, as intraday studies turn mixed. Daily readings have turned down and broader weekly charts are also under pressure, pointing to a deterioration in sentiment and room for further losses in the coming sessions. A close beneath here will add weight to sentiment and extend March 2020 losses towards historic (2014) congestion around 1.2550. Meanwhile, resistance is lowered to congestion around 1.2650. A close above here would help to stabilise price action and give way to consolidation beneath 1.2700.