Published: 2025-10-14T06:27:33.000Z
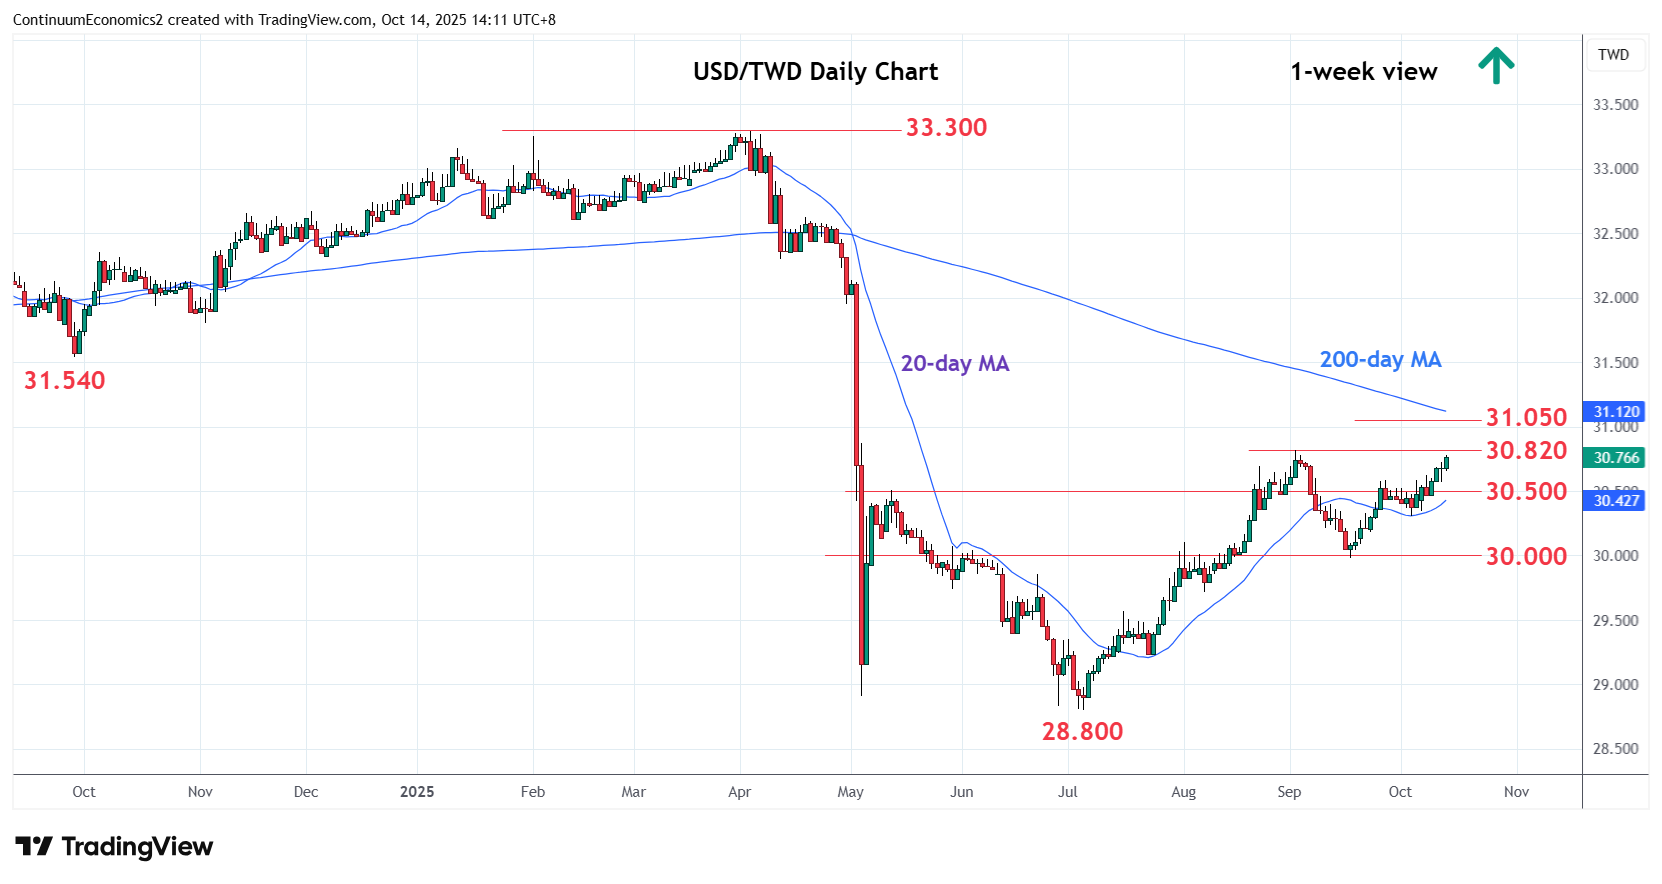
Chart USD/TWD Update: Extend corrective gains
-
Consolidation around 30.500 has given way to break extend bounce from the 30.000 level and September low
| Levels | Imp | Comment | Levels | Imp | Comment | |||
|---|---|---|---|---|---|---|---|---|
| R4 | 31.300 | congestion | S1 | 30.500 | congestion | |||
| R3 | 31.120 | * | 200-day MA | S2 | 30.310 | * | 3 Oct low | |
| R2 | 31.050 | * | 50% Apr/Jul fall | S3 | 30.000 | ** | Sep low | |
| R1 | 30.820 | ** | Sep high | S4 | 29.720 | * | 7 Aug low |
06:20 GMT - Consolidation around 30.500 has given way to break extend bounce from the 30.000 level and September low. Positive daily and weekly studies keep pressure on the upside with the 30.820 high now within reach. Clearance here will extend gains from the July low to retrace losses from the April high to the 31.000 level and 31.050, 50% Fibonacci level. Higher still, will see room to the 200-day MA at 31.120. Meanwhile, support is raised to the 30.500 congestion and extending to 30.310, 3rd October low. This area should now underpin and sustain corrective gains from the 28.800, July low.