This week's five highlights
Markets and the Iran War
U.S. February Employment Not as strong as January
This Week's Fed Speakers
China Aims 4.5-5.0% GDP Growth
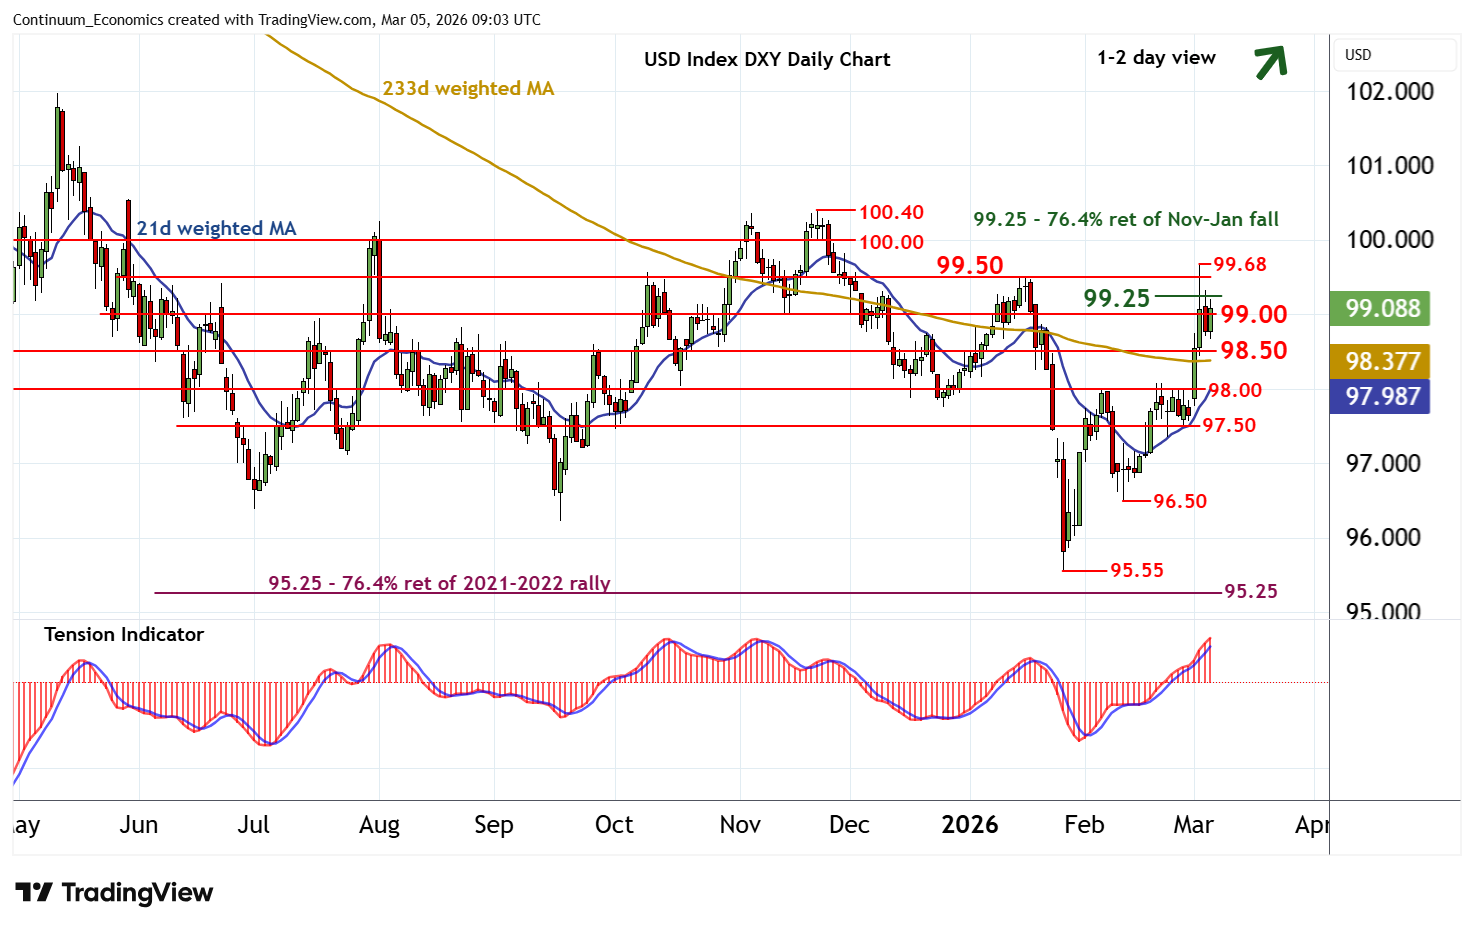
DXY Choppy in range
Figure: Global Gas Prices (Feb 2025 = 100)
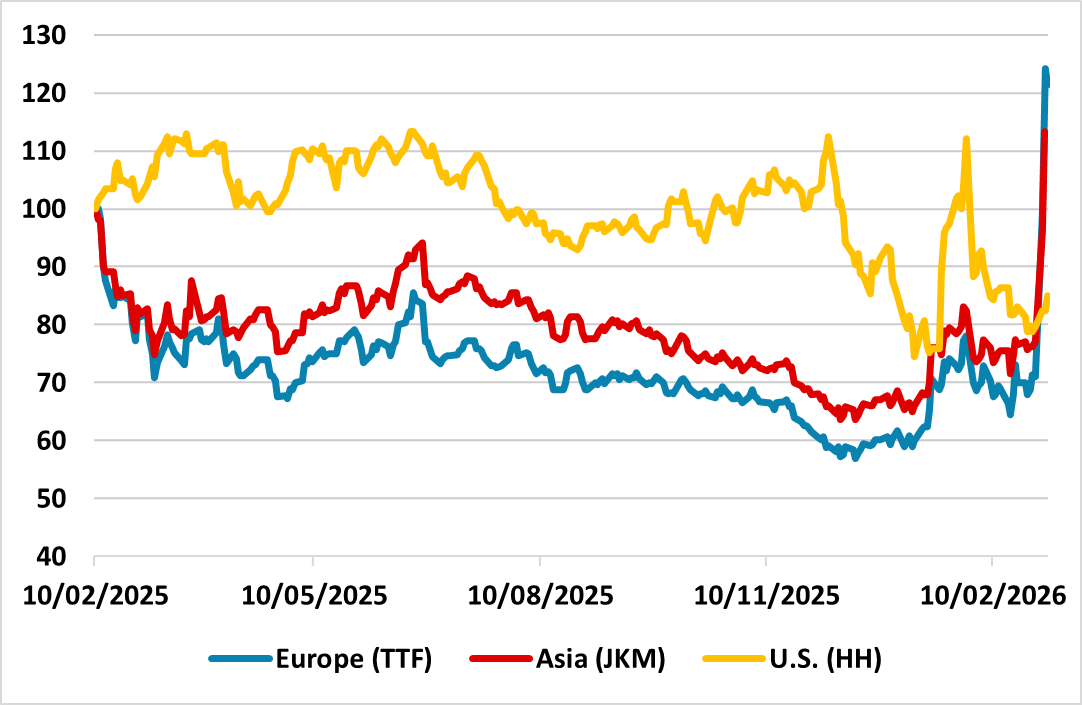
The Trump administration’s objective appears to be pivoting from regime change to hurting Iran ballistic missile capabilities, which argues for a 2-4 week war rather than a prolonged war. However, the most intense missile battles will likely occur in the next one week and markets are hyper sensitive to oil or gas production or export facilities being hit and how long they will stop production/exports. Uncertainty also exists whether enough Gulf countries interceptor missiles exist for Iran drones. Risk off has not finished yet.
The initial reaction has been a parallel shift upwards in yield curve on fears that the inflation shock could have some 2nd round effects and mean that DM central banks (Fed and BOE) cannot cut interest rates in the coming months and that easing over the next 12 months could be smaller. However, central banks are likely to look through the increase in oil and gas prices on the view that they will be temporary and with only modest economic momentum argues against the idea of rate hikes (except those already planned in Japan and Australia). This could mean that the front-end of some DM curves attract interest in U.S./UK, especially if remaining Iran officials were to become open to the idea of restarting talks with the U.S. (the shift of view could come as early as next week, when Iran missile stocks become low and though of survival prompt regime transformation). Other traditional safe havens have been mixed with gold in favour, but the Japanese Yen out of fashion. However, the JPY has become so undervalued, that a snap higher could be seen on a worsening of the Iran war and hints that the worst could be over.
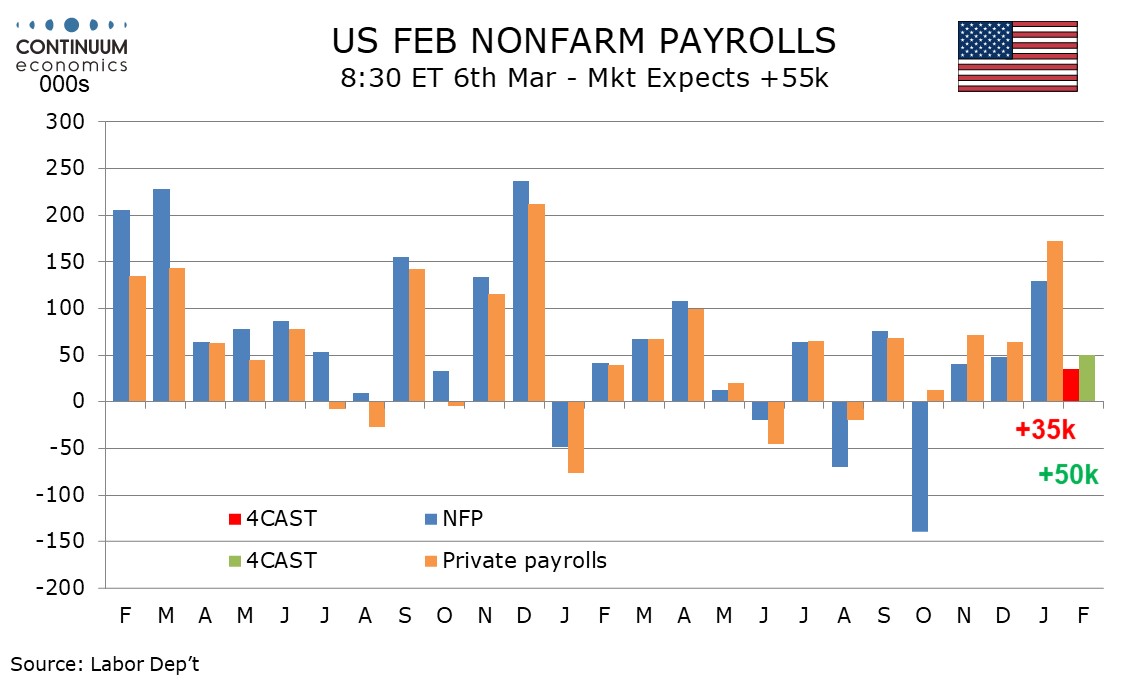
We expect February’s non-farm payroll to rise by 35k overall and by 50k in the private sector, both four month lows and significantly slower than January’s above trend respective gains of 130k and 172k. We expect unemployment to edge up to 4.4% from 4.3%, reversing a January dip, and average hourly earnings to rise by 0.3%, in line with trend. January’s strength was led by health care, which increased by 123.5k, and a significant slowing is likely in February, though the sector is still likely to fully explain February’s payroll gain, and most of that in the private sector. Revisions tend to be negative and January data may be revised lower, though probably only by around 25k, leaving the month still well above the late 2025 trend.
January’s data was supported by strongly positive seasonal adjustments, which turn negative in February. January’s data was also surveyed before some bad weather in late January, which would weigh on February data, though initial claims were back to normal in February’s payroll survey week after a bounce during the cold weather spell. A clearly negative payroll looks unlikely.
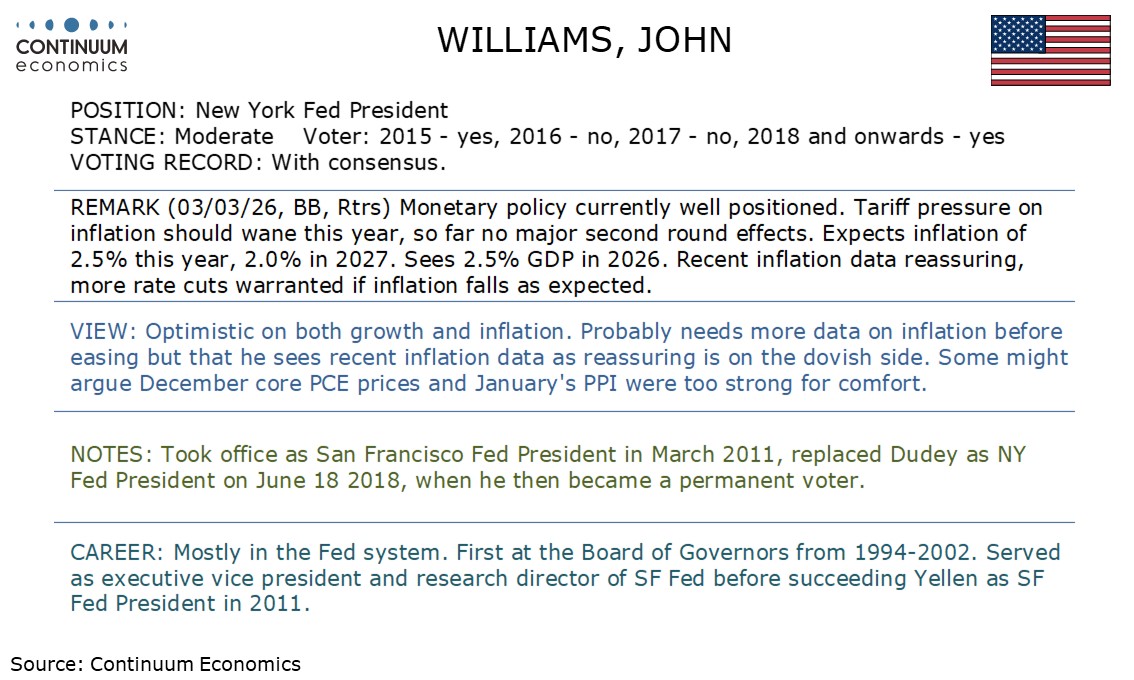
Figure: Yuan Nominal and Real Effective Exchange Rate (%)
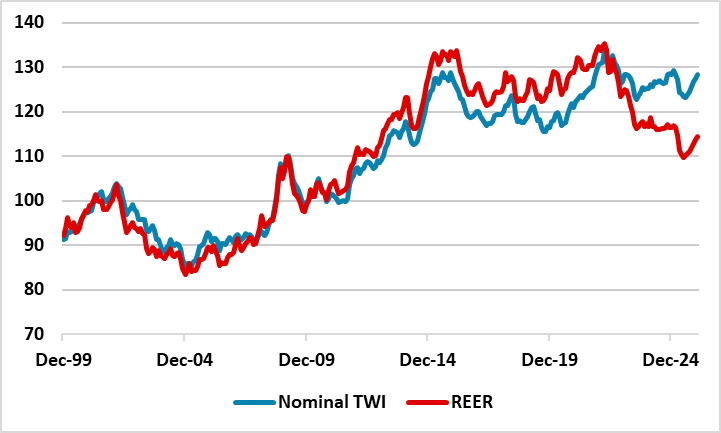
The Yuan has continued to appreciate with no resistance from China authorities. Part of this is a willingness to allow a modest Yuan appreciation in the face of the huge China trade surplus and pressure from U.S./Europe/IMF and others over an undervalued Yuan, but appreciation is also designed to soften U.S. trade pressures and the risk of an aggressive section 301 action from the U.S. China also wants the trade truce to continue, but is reluctant to deliver Trump’s desired trade deal with China. This could make a 5% growth target difficult to achieve and a reason why China goes for a 4.5-5.0% 2026 GDP target.
China announced a central government budget deficit at 4% of GDP, which is the same as last year and points to only modest fiscal stimulus. Though investment was supported, consumption trade in programs were cut from Y300bln to Yuan250 and no new structural safety net for households have yet been announced. Consumption was the 4th priority and the 4.5-5.0% growth target is an acceptance that cyclical headwinds remain (residential property investment and modest consumption growth) and structural forces are having an impact (population aging). All of this is modest support and we see no reason to change our 4.4% GDP forecast for 2026.
USD has been favored by market participants as the go-to haven asset. It even beats Gold and JPY in the first rush of fear after U.S. strikes Iran. Going forward, as the dust settles, the greenback will likely rotate lower with market participants returning to physical haven asset, like precious metal to hedge the uncertainty. Yet, in times of turbulence, DXY could see another spike.
On the chart, the anticipated test below 99.00 has bounced from 98.67, with prices once again trading above congestion support at 99.00. Intraday studies are mixed and overbought daily stochastics are unwinding, suggesting room for further consolidation above here. But the rising daily Tension Indicator and positive weekly charts highlight later gains. Resistance is at the 99.25 Fibonacci retracement. A close above here will improve price action and extend late-January gains beyond 99.50 and the 99.68 current year high of 3 March towards congestion around 100.00. Meanwhile, any fresh tests below 99.00 should meet renewed buying interest above congestion support at 98.50.