Published: 2026-03-05T05:13:22.000Z
Chart USD/INR Update: Turned down from 92.3025 high
1
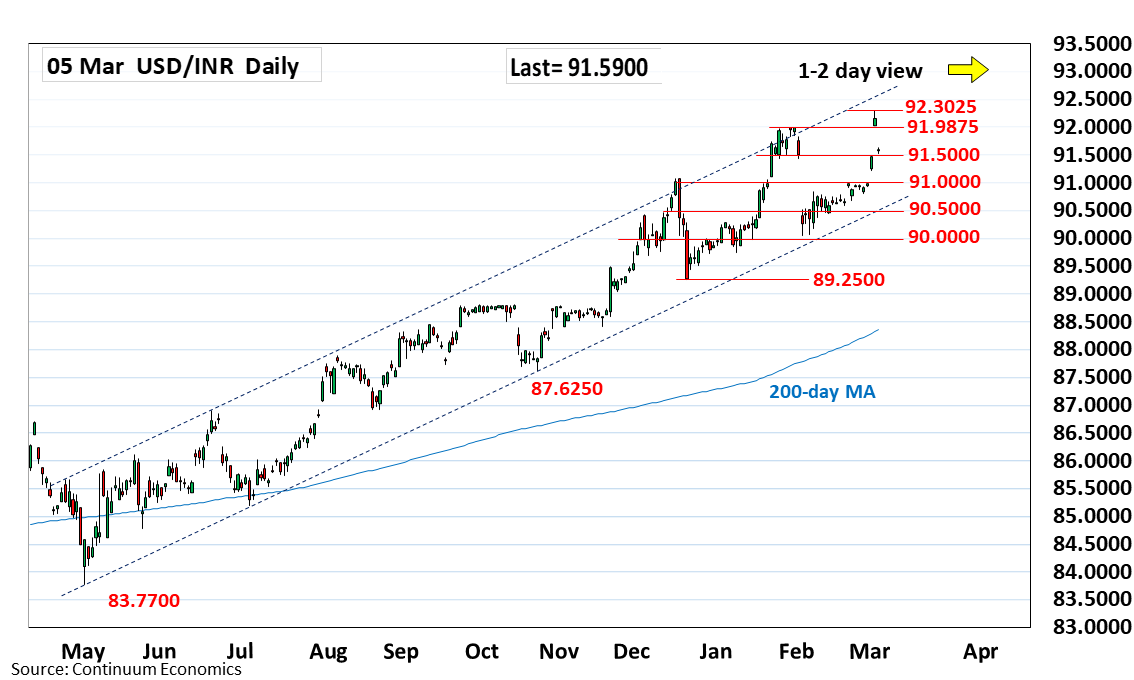
Sharply lower at the open as prices turned back from the 92.3025 historic high to retrace strong gains from the February low
| Level | Comment | Level | Comment | |||||
|---|---|---|---|---|---|---|---|---|
| R4 | 92.7800 | * | extension | S1 | 91.5000 | * | congestion | |
| R3 | 92.5000 | * | extension | S2 | 91.0750 | ** | Dec 2025 year high | |
| R2 | 92.3025 | ** | 4 Mar all-time high | S3 | 90.5000 | * | congestion | |
| R1 | 91.9875 | * | Jan high | S4 | 90.0450 | ** | 3 Feb low |
Asterisk denotes strength of level
05:10 GMT - Sharply lower at the open as prices turned back from the 92.3025 historic high to retrace strong gains from the February low. Support starts at 91.5000 congestion and break here will open up room for deeper pullback to strong support at 91.075/91.0000, December 2025 year high and congestion area. Break here will return focus to the downside and see room to the 90.5000 congestion and channel support. Meanwhile, resistance is lowered to 91.9875 January high which is expected to cap and sustain losses from the 92.3025 high.