Published: 2026-03-04T03:35:44.000Z
Chart USD/THB Update: Consolidating spike high to 31.95
1
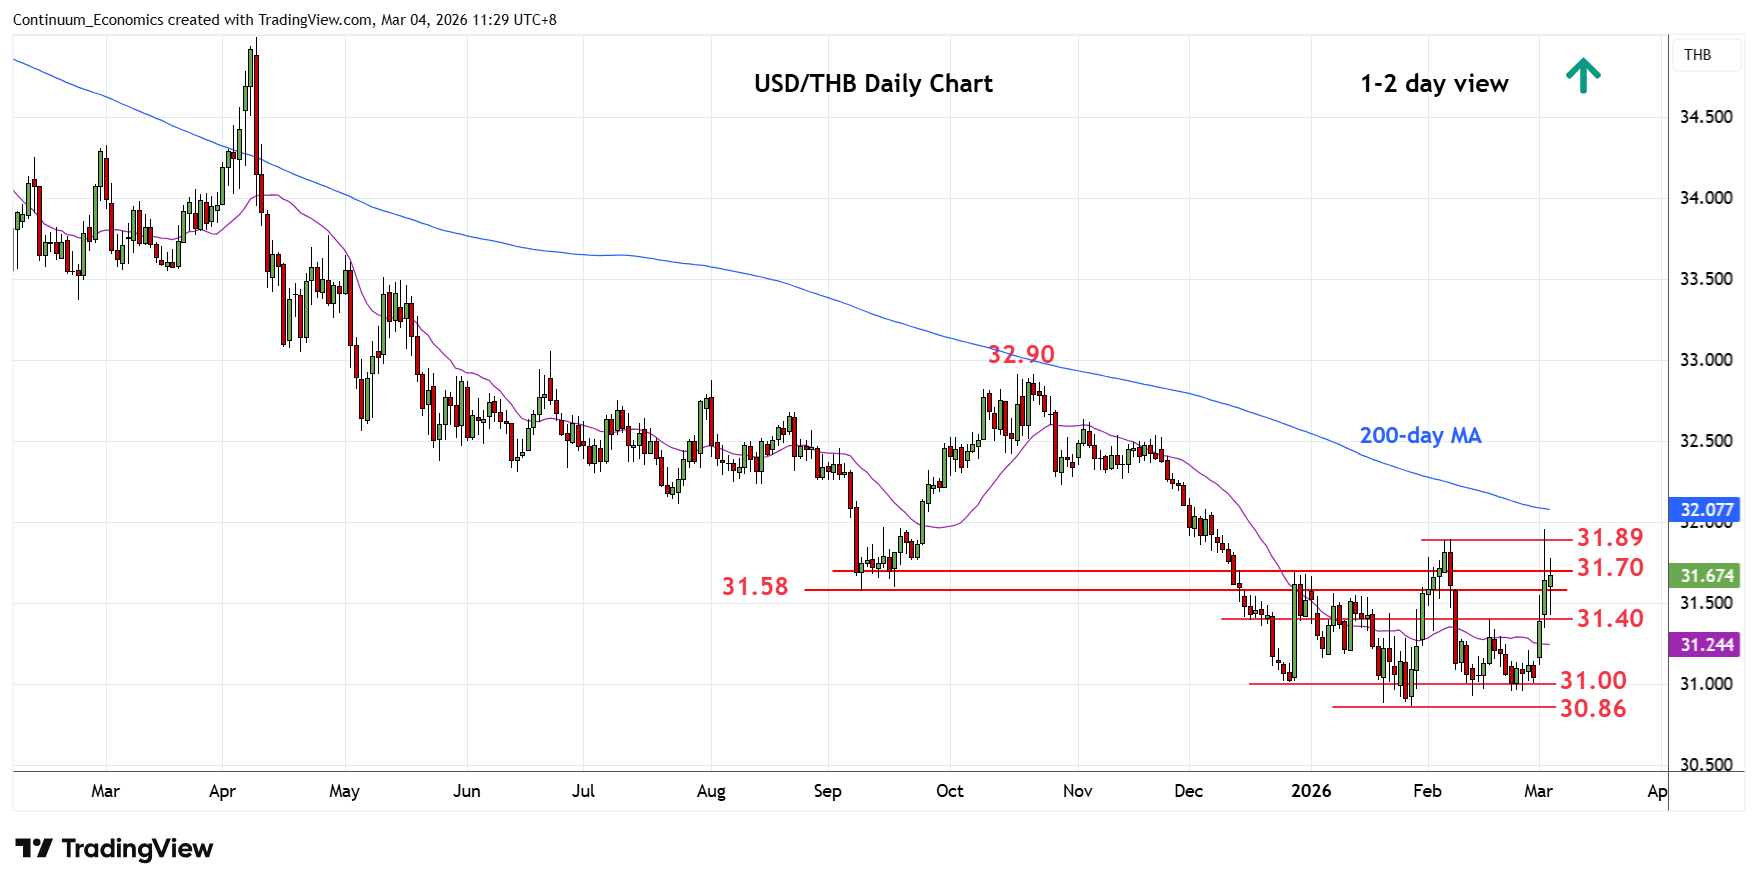
Settled back from the 31.95 spike high as prices consolidate sharp rally this week
| Level | Comment | Level | Comment | |||||
|---|---|---|---|---|---|---|---|---|
| R4 | 32.12 | * | 61.8% Oct/Jan fall | S1 | 31.50 | * | congestion | |
| R3 | 31.95 | ** | 3 Mar YTD high | S2 | 31.40 | ** | 17 Feb high | |
| R2 | 31.89 | ** | Feb high | S3 | 31.20 | * | congestion | |
| R1 | 31.70 | * | congestion | S4 | 31.00 | * | congestion |
Asterisk denotes strength of level
03:25 GMT - Settled back from the 31.95 spike high as prices consolidate sharp rally this week above resistance the 31.20 congestion. Positive daily and weekly studies suggest consolidation giving way to renewed buying interest later and clear break above the 31.89 February high will confirm a bottom pattern at the 31.00/30.86 lows. Clearance will see room for stronger gains to retrace losses from the October high to 32.12, 61.8% Fibonacci level. Meanwhile, support is raised to the 31.50/31.40 congestion area which should underpin and sustain bounce from the 30.86, 28 January current year low.