Published: 2025-11-04T06:19:08.000Z
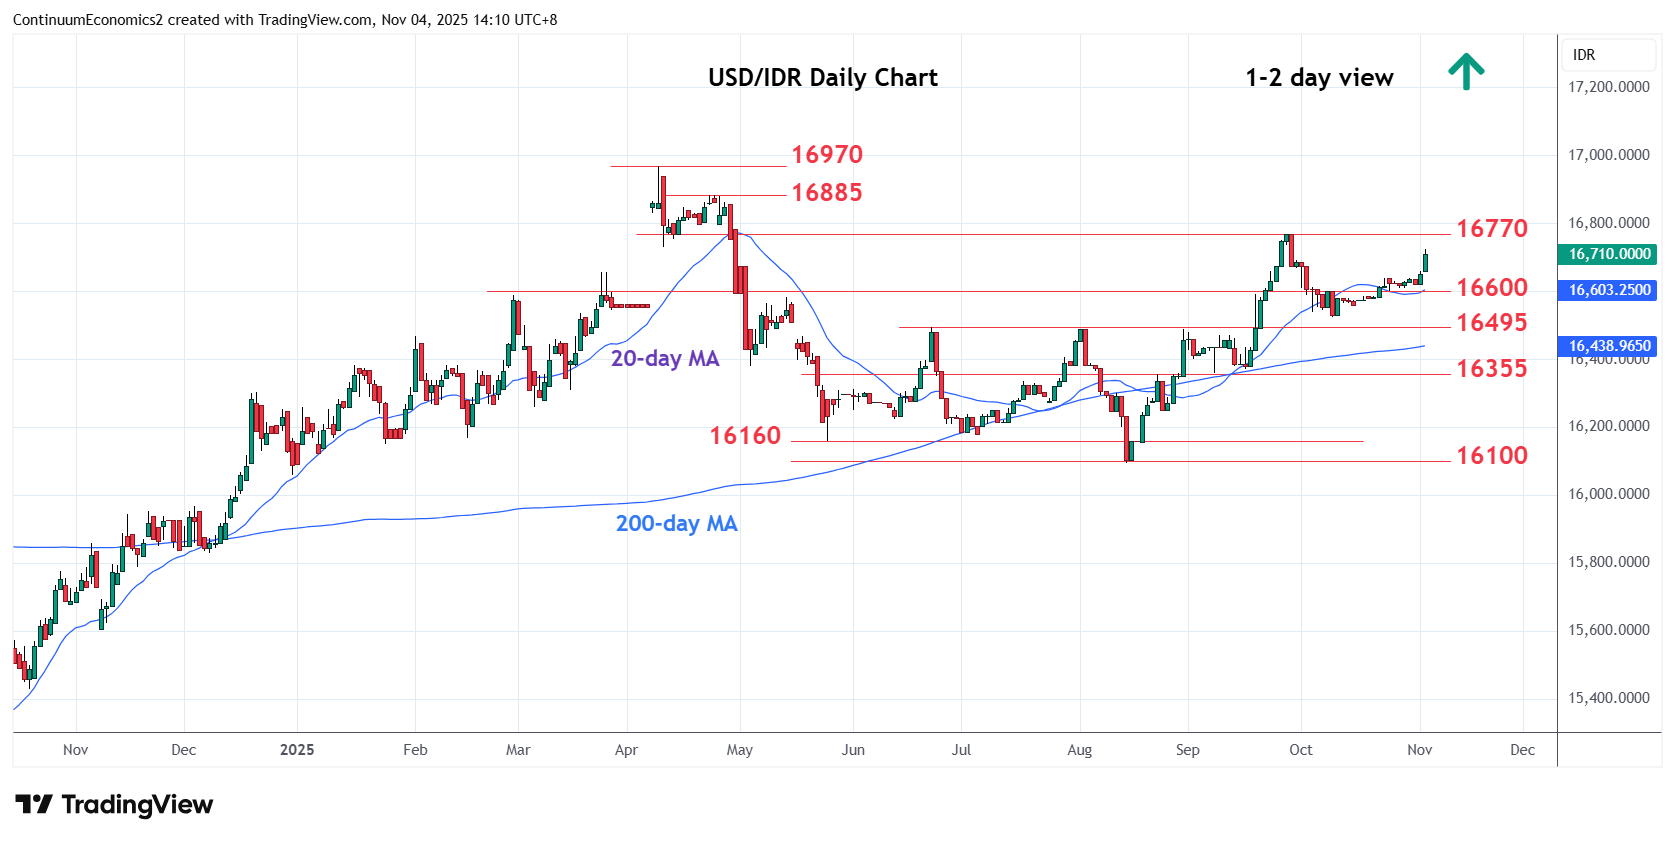
Chart USD/IDR Updates: Retest 16700/16730 resistance
3
Sharp bounce from above the 16600 level see pressure returning to the upside to reach the 16700/16730 resistance
| Levels | Imp | Comment | Levels | Imp | Comment | |||
|---|---|---|---|---|---|---|---|---|
| R4 | 16885 | * | 23 Apr high | S1 | 16600 | * | congestion | |
| R3 | 16800 | * | congestion | S2 | 16525 | * | 9 Oct low | |
| R2 | 16770 | ** | 26 Sep high | S3 | 16495 | ** | Jun high | |
| R1 | 16700 | * | figure | S4 | 16355/350 | * | 61.8%, congestion |
Asterisk denotes strength of level
06:15 GMT - Sharp bounce from above the 16600 level see pressure returning to the upside to reach the 16700/16730 resistance. Higher will see room to retest the 16770 high of September where reaction is expected to unwind overbought daily studies. Clearance here, if seen, will extend the broader gains from the 16100 August low and see room to 16800 congestion and 16885 resistance. Meanwhile, support is at 16600 congestion which should underpin. Would take break here to open up room for deeper pullback to 16525 October low and strong support at the 16495, June-August range highs.