Published: 2026-05-04T05:35:15.000Z
Chart USD/INR Update: Leaning lower from 95.3300 record high
1
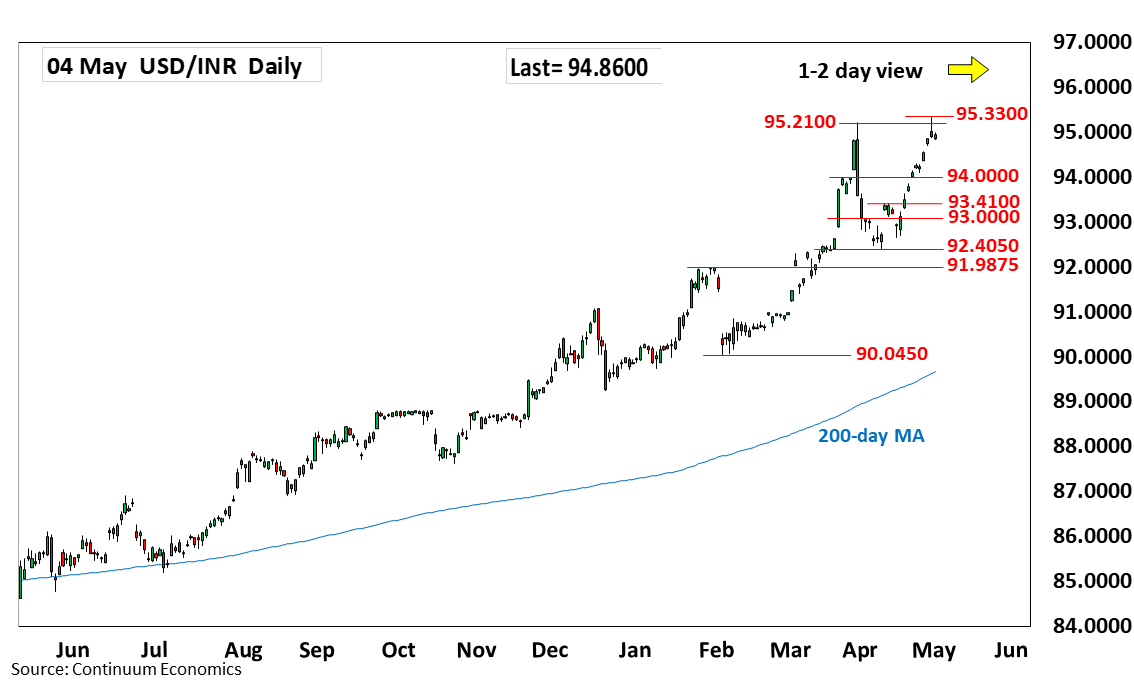
Leaning lower as prices extend pullback from the 95.3300 historic high as prices unwind overbought daily studies
| Level | Comment | Level | Comment | |||||
|---|---|---|---|---|---|---|---|---|
| R4 | 96.0000 | figure | S1 | 94.3050 | * | 24 Apr high | ||
| R3 | 95.5000 | figure | S2 | 94.0000 | ** | figure, congestion | ||
| R2 | 95.3850 | projection | S3 | 93.4100 | ** | 15 Apr high | ||
| R1 | 95.3300 | ** | 30 Apr all-time high | S4 | 93.0000 | * | figure |
Asterisk denotes strength of level
05:30 GMT - Leaning lower as prices extend pullback from the 95.3300 historic high as prices unwind overbought daily studies following strong gains from the 92.4050, 10 April low. However, further gain cannot be ruled out and higher will see scope to retest the 95.3850 projection target and 95.5000 level. Meanwhile, support remains at 94.3050 high and extending to the 94.0000 level. This area should underpin and see break here needed to ease the upside pressure and open up room for deeper pullback to strong support at the 93.4100, 15 April high.