Published: 2025-09-17T05:14:38.000Z
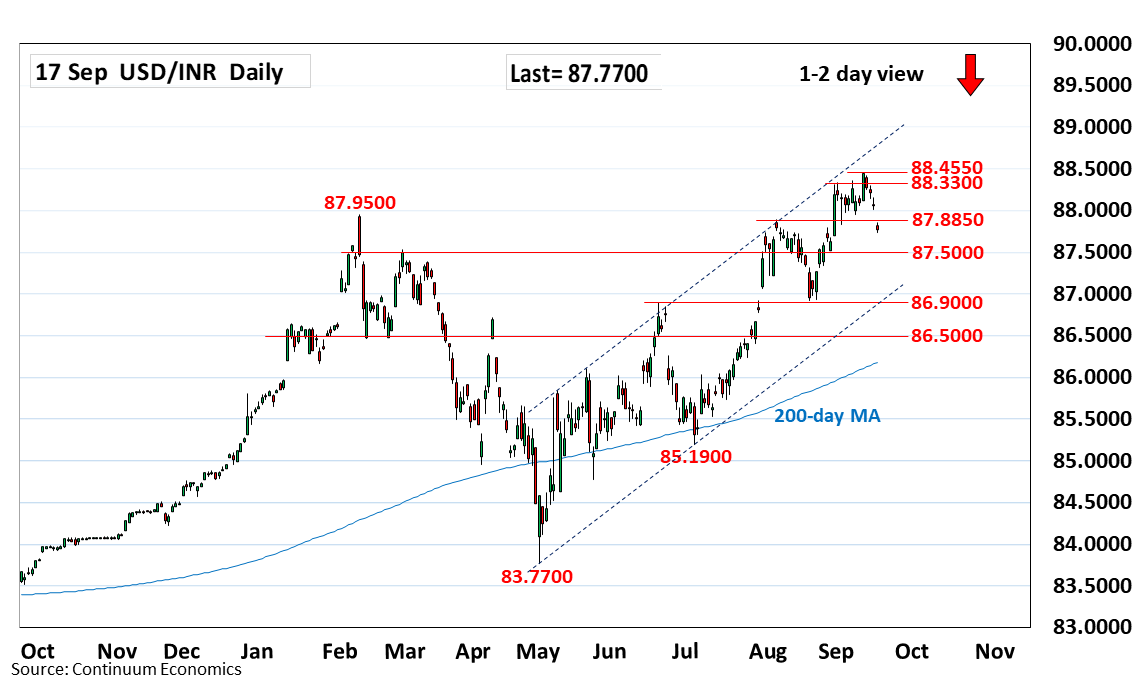
Chart USD/INR Update: Extending pullback from 88.4550 high
-
Gapped down at the opening through the 88.0000 level and 87.8850 support see prices extending pullback from 88.4550 all-time high
| Level | Comment | Level | Comment | |||||
|---|---|---|---|---|---|---|---|---|
| R4 | 88.5000 | * | figure | S1 | 87.5000 | * | congestion | |
| R3 | 88.4550 | ** | 11 Sep all-time high | S2 | 87.0000 | * | figure | |
| R2 | 88.3300 | * | 1 Sep high | S3 | 86.9000 | ** | Jun high | |
| R1 | 88.0000 | * | figure | S4 | 86.5000 | * | congestion |
Asterisk denotes strength of level
05:10 GMT - Gapped down at the opening through the 88.0000 level and 87.8850 high of 5 August see prices extending pullback from the 88.4550, 11 September all-time high. Lower will see room for deeper pullback to correct strong gains from the 88.1900 July low to the 87.5000 congestion. Below this will open up room to the strong support at the 87.0000/86.9000 congestion and June high. Meanwhile, resistance is lowered to the 88.0000 level which is expected to cap and sustain pullback from 88.4550 high.