Published: 2026-02-26T05:08:58.000Z
Chart USD/INR Update: Extend consolidation below 91.0000
1
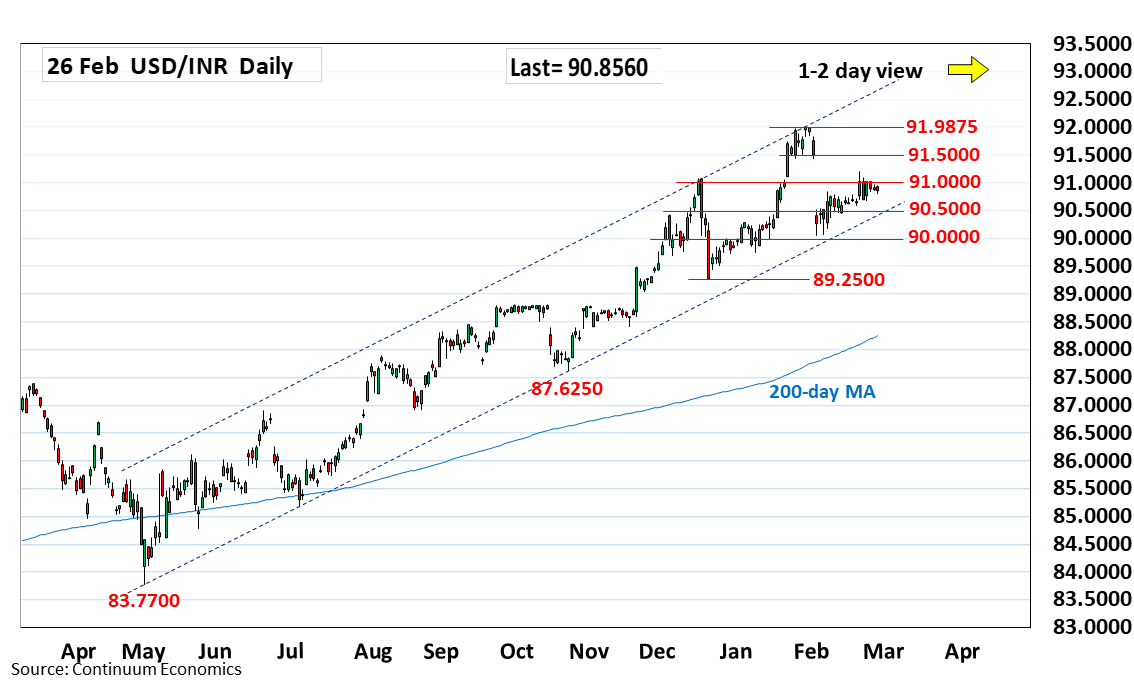
Little change, as prices extend consolidation within a narrow range below the 91.0000 level
| Level | Comment | Level | Comment | |||||
|---|---|---|---|---|---|---|---|---|
| R4 | 92.1300 | * | extension | S1 | 90.5000 | * | congestion | |
| R3 | 91.9875 | ** | 30 Jan all-time high | S2 | 90.0450 | * | 3 Feb low | |
| R2 | 91.5000 | * | congestion | S3 | 89.7400 | * | Jan low | |
| R1 | 91.2040 | ** | 19 Feb high | S4 | 89.5000 | * | congestion |
Asterisk denotes strength of level
05:00 GMT - Little change, as prices extend consolidation within a narrow range below the 91.0000 level following pullback from 91.2040 high. Negative daily and weekly studies suggest room for deeper pullback to retrace gains from the 90.0450 February low. Break of the 90.5000 support to return focus to the 90.0450 low and the 90.0000 figure. Below these will extend the broader losses from the 91.9875 January all-time high. Meanwhile, resistance at the 91.0000 level and 91.2040 high are expected to cap.