Published: 2026-02-05T08:07:53.000Z
Chart USD/MXN Update: Extend consolidation above 17.1000, January low
1
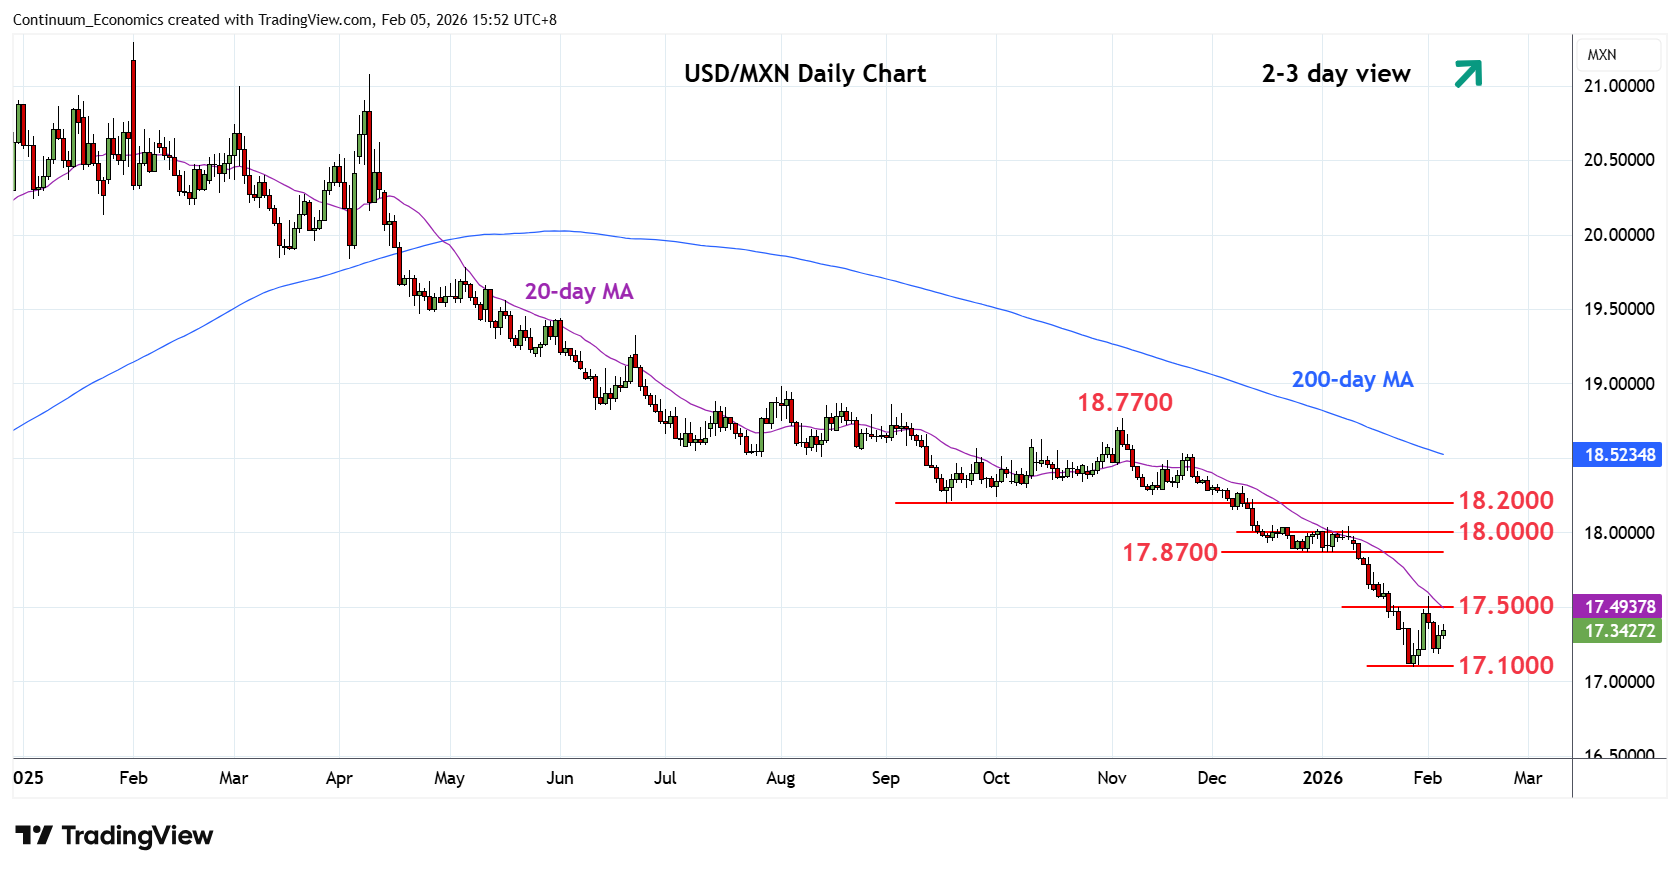
Extending consolidation above the 17.1000 January low as prices unwind oversold daily studies
| Levels | Imp | Comment | Levels | Imp | Comment | |||
|---|---|---|---|---|---|---|---|---|
| R4 | 18.0000 | * | figure | S1 | 17.1000 | * | 28 Jan YTD low | |
| R3 | 17.8700 | ** | Dec 2025 year low | S2 | 17.0000 | ** | congestion | |
| R2 | 17.5700 | * | 2 Feb high | S3 | 16.9150 | * | June 2024 low | |
| R1 | 17.5000 | * | congestion | S4 | 16.7500 | ** | congestion |
Asterisk denotes strength of level
08:00 GMT - Extending consolidation above the 17.1000 January low as prices unwind oversold daily studies. However, bounce attempt has seen gains checked at 17.5000/17.5700 area. Would take break here to open up room for stronger gains to correct losses from the November swing high to resistance at the 17.8700/18.0000 area. However, bearish structure suggest correction to give way to renewed selling pressure later to extend losses from the February 2025 high. Break of the 17.1000 low will open up room for extension to the 17.0000 figure and lower.