Published: 2026-04-06T00:32:42.000Z
Chart AUD/USD Update: Lower in consolidation
1
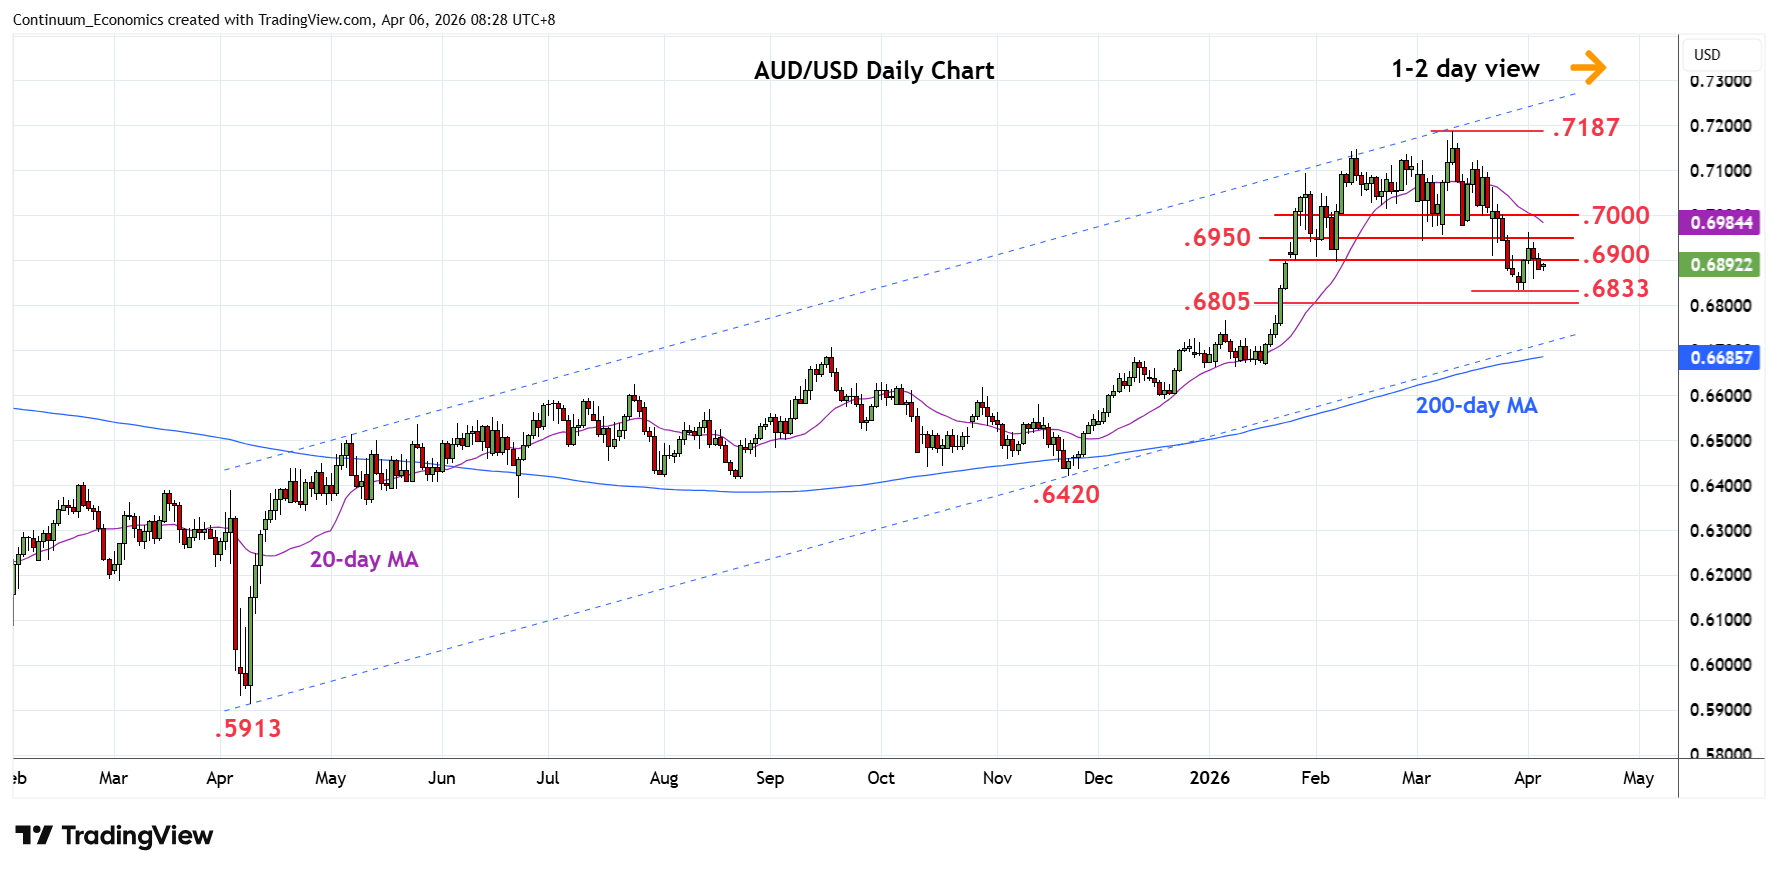
Little change, as prices consolidate at the .6900 level following rejection from resistance the .6950/80 area
| Levels | Imp | Comment | Levels | Imp | Comment | |||
|---|---|---|---|---|---|---|---|---|
| R4 | 0.7050 | * | congestion | S1 | 0.6833 | ** | 30 Mar low | |
| R3 | 0.7000 | ** | congestion | S2 | 0.6805 | * | 50% Nov/Mar rally | |
| R2 | 0.6980 | * | 13 Mar low | S3 | 0.6765 | * | 7 Jan high | |
| R1 | 0.6950 | * | congestion | S4 | 0.6715 | * | 61.8%, congestion |
Asterisk denotes strength of level
00:20 GMT - Little change, as prices consolidate at the .6900 level following rejection from resistance the .6950/80 area. While the latter caps scope is seen for drop back to retest the .6833. Break here will extend losses from the .7187 March current year high and see deeper pullback to retrace gains from the November low to .6805, 50% Fibonacci level. Lower still, will see room for .6765 support and .6715, 61.8% Fibonacci level. Would take break of resistance at the .6950/80 area and the .7000 figure to ease the downside pressure and revive upside focus.