Continuum Economics
  • Search
  • About Us
  • Buy
  • Invite A Friend
  • My Basket
  • Articles
  • Calendar
  • Forecasts
  • Events
  • Data
  • Newsletters
  • My Alerts
  • Community
  • Directory
  • About Us
  • Buy
  • Invite A Friend
  • My Basket
  • Articles
    • All
    • Thematic
    • Tactical
    • Asia
    • EMEA
    • Americas
    • Newsletters
    • Freemium
    • Editor's Choice
    • Most Viewed
    • Most Shared
    • Most Liked
  • Calendar
    • Interactive
      • China
      • United States
      • Eurozone
      • United Kingdom
    • Month Ahead
    • Reviews
    • Previews
  • Forecasts
    • Forecasts
    • Key Views
  • Events
    • Media
    • Conference Calls
  • Data
    • Country Insights
    • Shadow Credit Ratings
    • Full CI Data Download
  • Newsletters
  • My Alerts
  • Community
    • FX
    • Fixed Income
    • Macro Strategy
    • Credit Markets
    • Equities
    • Commodities
    • Precious Metals
    • Renewables
  • Directory
  • My Account
  • Notifications Setup
  • Administration Panel
  • Account Details
  • Recent Devices
  • Distribution Lists
  • Shared Free Trials
  • Saved Articles
  • Shared Alerts
  • My Posts
Published: 2025-09-12T09:53:23.000Z

Chartbook: Chart GER 10 Year Yield: Scope for a minor pullback in broad range

0
-

Choppy trade above the 2.436% monthly low of 30 April has given way to a drift higher to 2.800%

Choppy trade above the 2.436% monthly low of 30 April has given way to a drift higher to 2.800%,

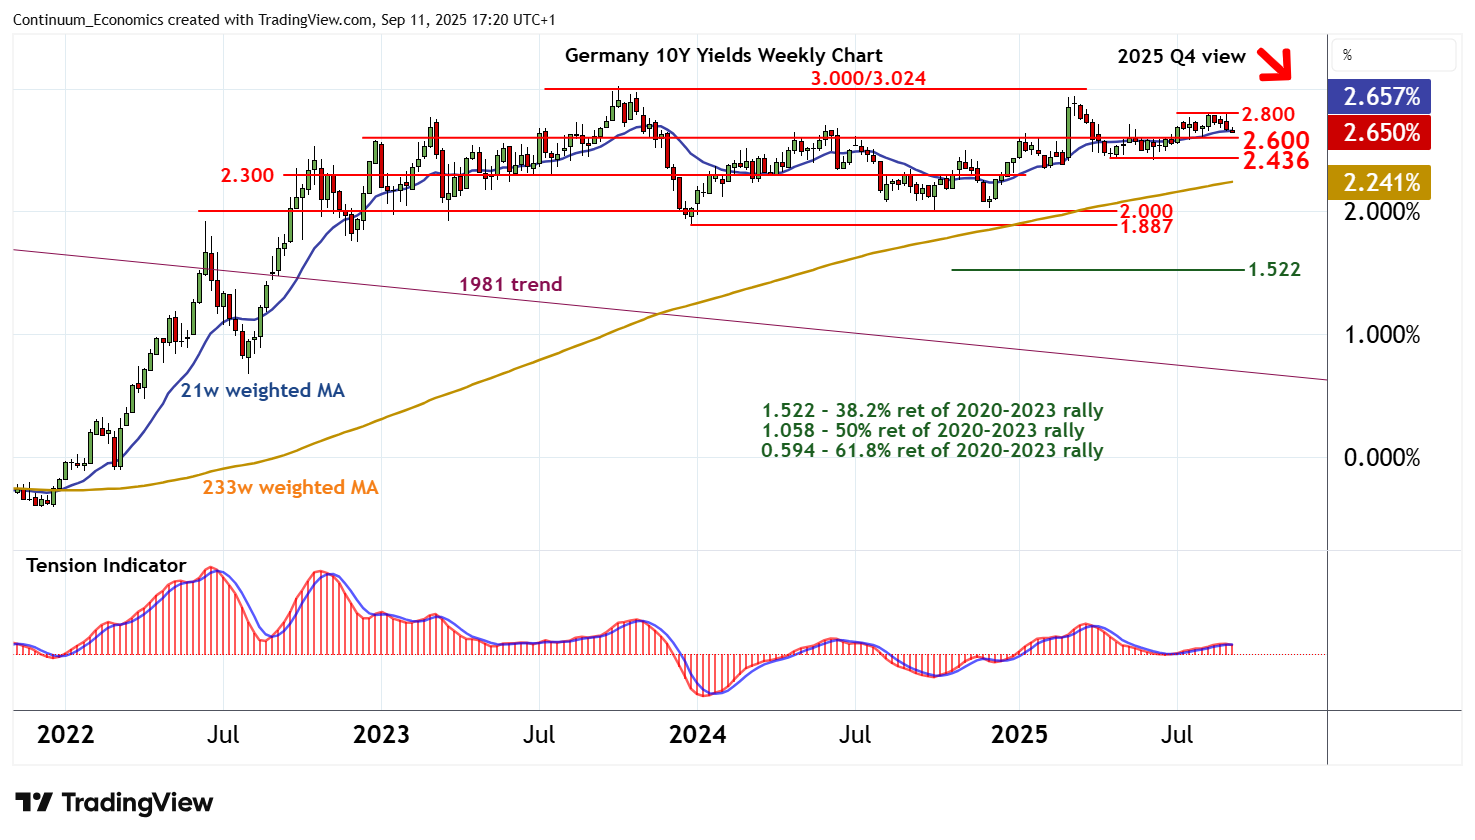
where a turn lower in both weekly stochastics and the weekly Tension Indicator are prompting a fresh drift lower.

Focus is on pivot support at 2.600%, with a break putting focus back on 2.436%.

Negative weekly studies highlight room for a later break beneath here towards stronger support at congestion around 2.300%.

But rising monthly charts should limit any deeper reactions in consolidation above critical support at the 1.887% year low of December 2023 and congestion around 2.000%.

Meanwhile, resistance is at the 2.800% weekly high of 3 September and break level,

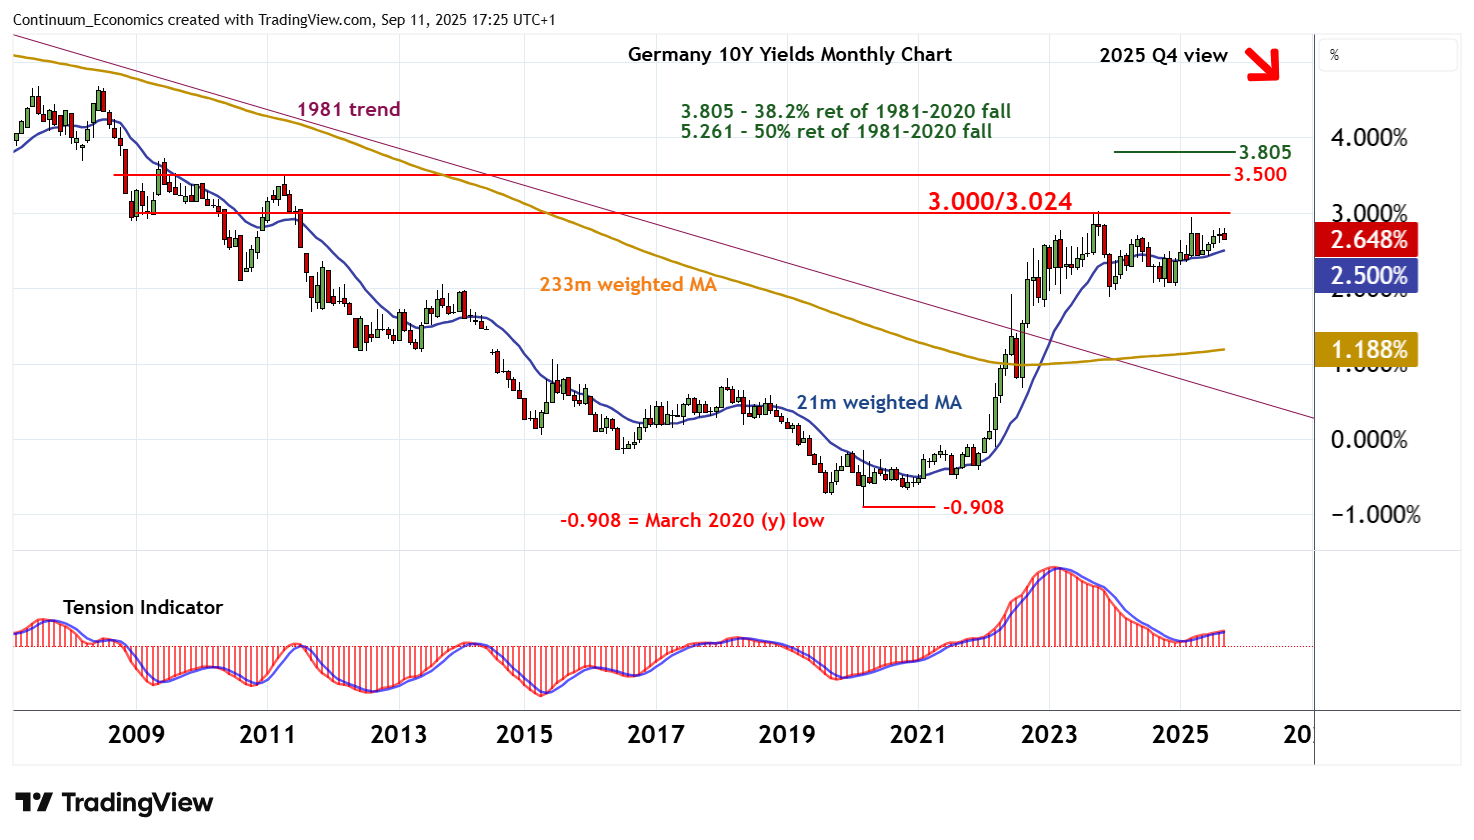
and extends to critical resistance at congestion around 3.000% and the 3.024% multi-year high of October 2023.

Any immediate bounce is expected to fade into further consolidation beneath 3.000/3.024%, as monthly stochastics are already overbought and longer-term charts are under pressure.

An unexpected close above here, however, will confirm a multi-month period of rising yields, as yields continue to correct the 1981 bear trend.

Continue to read the article for free
Login

or

or

Topics
Technical Analysis
ChartBook

GENERAL

  • Home
  • About Us
  • Our Team
  • Careers

LEGAL

  • Terms and Conditions
  • Privacy Policy
  • Compliance
  • GDPR

GET IN TOUCH

  • Contact Us
Continuum Economics
The Technical Analyst Awards Winner 2021
The Technical Analyst Awards Finalist 2020
image