Chart USD Index DXY Update: Sharp pullback
Cautious trade around 100.00 has given way to a sharp fall
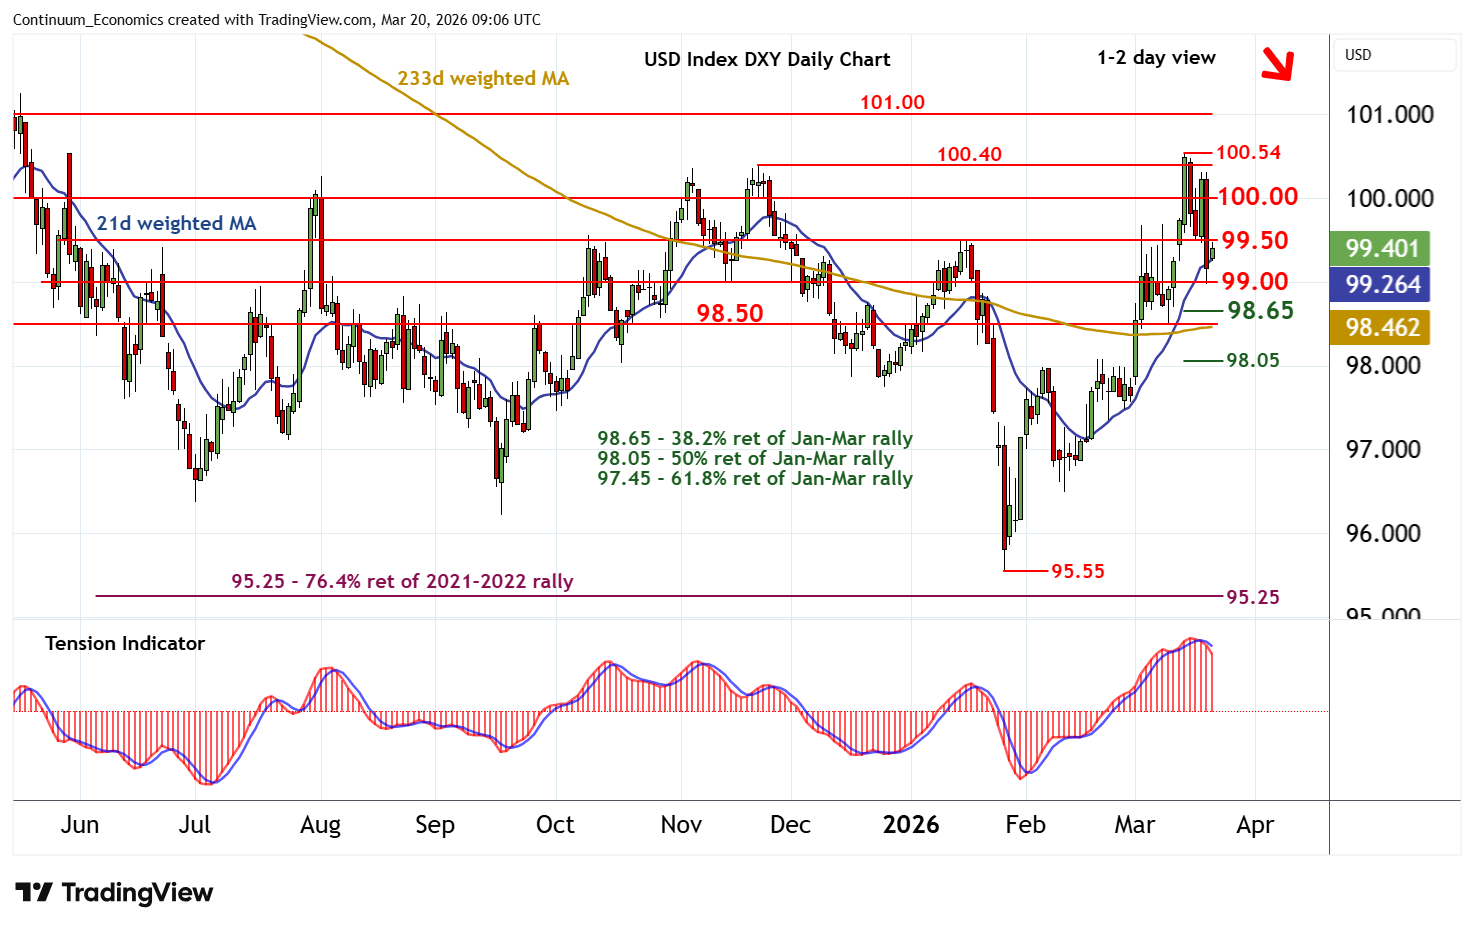
| Levels | Imp | Comment | Levels | Imp | Comment | |||
|---|---|---|---|---|---|---|---|---|
| R4 | 101.00 | * | congestion | S1 | 99.00 | ** | congestion | |
| R3 | 100.40/54 | ** | 21 Nov (m); 13 Mar YTD highs | S2 | 98.65 | * | 38.2% ret of Jan-Mar rally | |
| R2 | 100.00 | ** | congestion | S3 | 98.50 | * | congestion | |
| R1 | 99.50 | * | congestion | S4 | 98.00/05 | ** | congestion; 50% ret |
Asterisk denotes strength of level
08:50 GMT - Cautious trade around 100.00 has given way to a sharp fall, with steady selling interest reaching congestion support at 99.00 before settling into consolidation within the 99.00 - 99.50 range. Daily readings have turned down, highlighting room for continuation beneath 99.00. But rising weekly charts should limit initial scope in short-covering/consolidation towards strong support within further congestion around 98.50 and the 98.65 Fibonacci retracement. Meanwhile, resistance is lowered to congestion around 99.50. A close above here, if seen, would help to stabilise sentiment and prompt consolidation beneath further congestion around 100.00.