Published: 2026-01-12T01:53:28.000Z
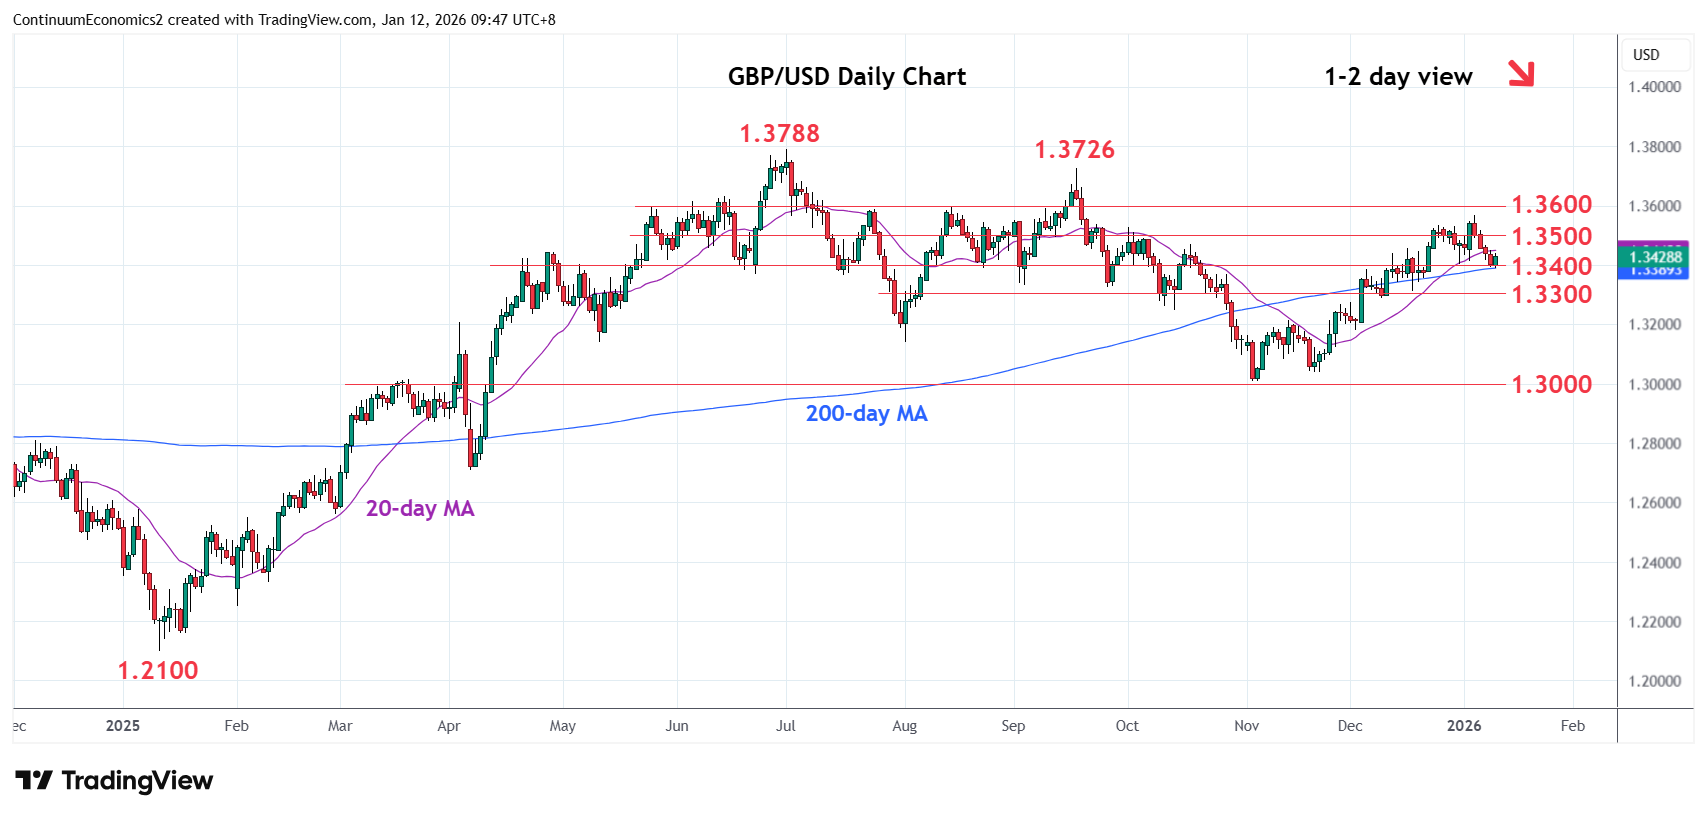
Chart GBP/USD Update: Consolidating test of 1.3400 support, room for lower later
-
Limited on break of the 1.3400 level as prices unwind oversold intraday studies and consolidate losses from the 1.3568 high
| Level | Comment | Level | Comment | |||||
|---|---|---|---|---|---|---|---|---|
| R4 | 1.3726 | ** | Sep high | S1 | 1.3400 | ** | 31 Dec low | |
| R3 | 1.3600 | * | congestion | S2 | 1.3350 | * | congestion | |
| R2 | 1.3568 | * | 6 Jan YTD high | S3 | 1.3300 | * | congestion | |
| R1 | 1.3500 | * | congestion | S4 | 1.3215/00 | ** | 13 Nov high, congestion |
Asterisk denotes strength of level
01:50 GMT - Limited on break of the 1.3400 level as prices unwind oversold intraday studies and consolidate losses from the 1.3568 high of last week. However, negative studies keep pressure on the downside and break here will open up room for deeper pullback to retrace gains from the 1.3010 November low. Lower will see room to support at the 1.3350/00 congestion area. Corrective pullback is expected to give way to renewed buying interest later. Regaining the 1.3500 level will expose the 1.3568 high to retest and see room for extension to the 1.3600 level.