Chart EUR/USD Update: Further losses to remain limited

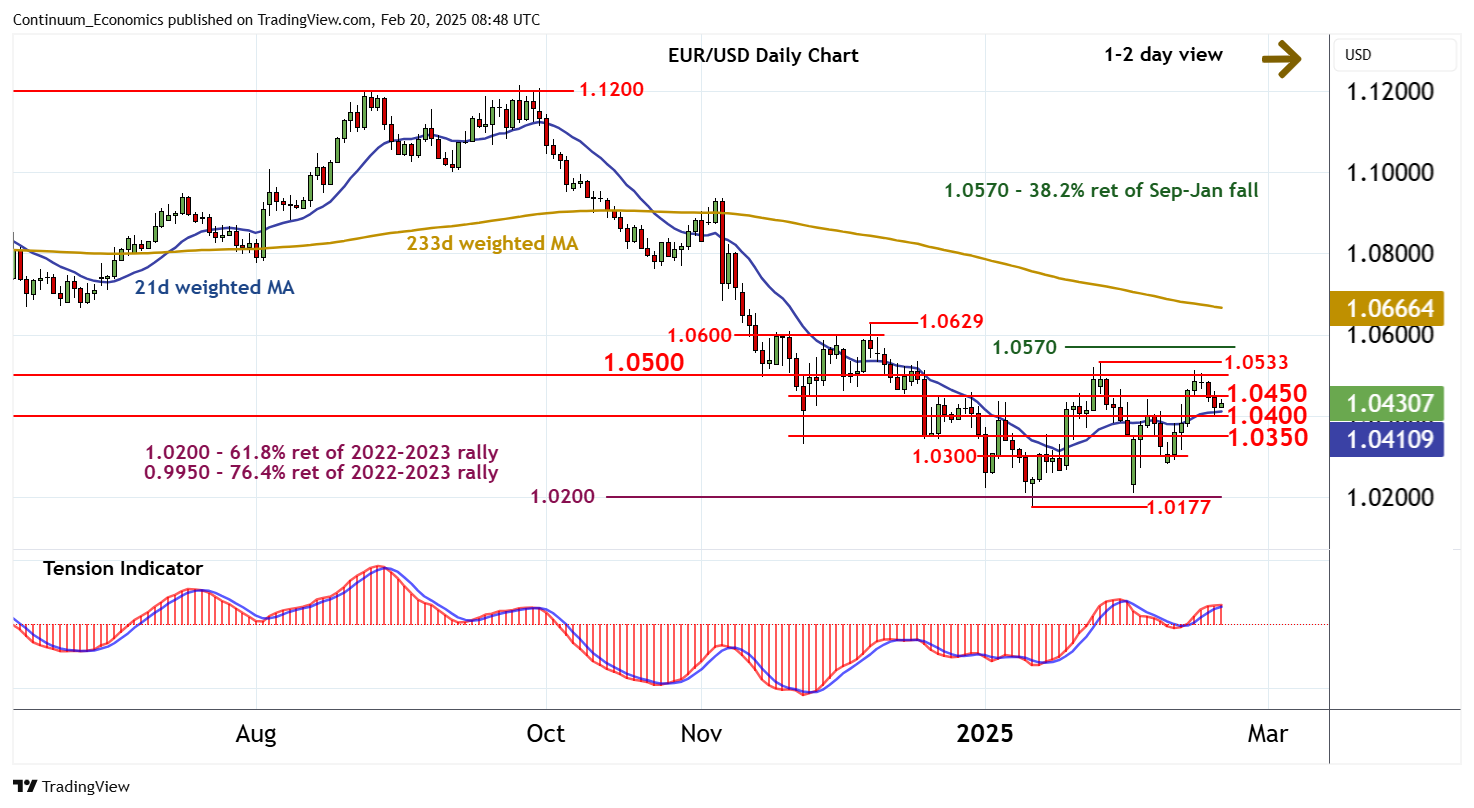
Anticipated losses have reached congestion support at 1.0400
| Levels | Imp | Comment | Levels | Imp | Comment | |||
|---|---|---|---|---|---|---|---|---|
| R4 | 1.0570 | ** | 38.2% ret of Sep-Jan fall | S1 | 1.0400 | ** | congestion | |
| 14 | 1.0533 | ** | 27 Jan YTD high | S2 | 1.0350 | * | break level | |
| R2 | 1.0500 | * | break level | S3 | 1.0300 | congestion | ||
| R1 | 1.0450 | congestion | S4 | 1.0200 | ** | 61.8% ret of 2022-2023 rally |
Asterisk denotes strength of level
08:35 GMT - Anticipated losses have reached congestion support at 1.0400, where rising intraday studies are prompting fresh consolidation. Daily stochastics continue to track lower and the positive daily Tension Indicator is flattening, suggesting potential for a test beneath here. But rising weekly charts should limit any break in renewed buying interest/consolidation towards 1.0350. Following corrective trade, fresh gains are looked for. A break back above 1.0450 will target 1.0500. But a close above the 1.0533 current year high of 27 January is needed to turn sentiment positive and confirm continuation of January gains, initially to the 1.0570 Fibonacci retracement.