Chart USD Index DXY Update: Reached the 106.65 Fibonacci retracement - studies under pressure

The test of strong support at the 106.55 Fibonacci retracement is giving way to consolidation
| Levels | Imp | Comment | Levels | Imp | Comment | |||
|---|---|---|---|---|---|---|---|---|
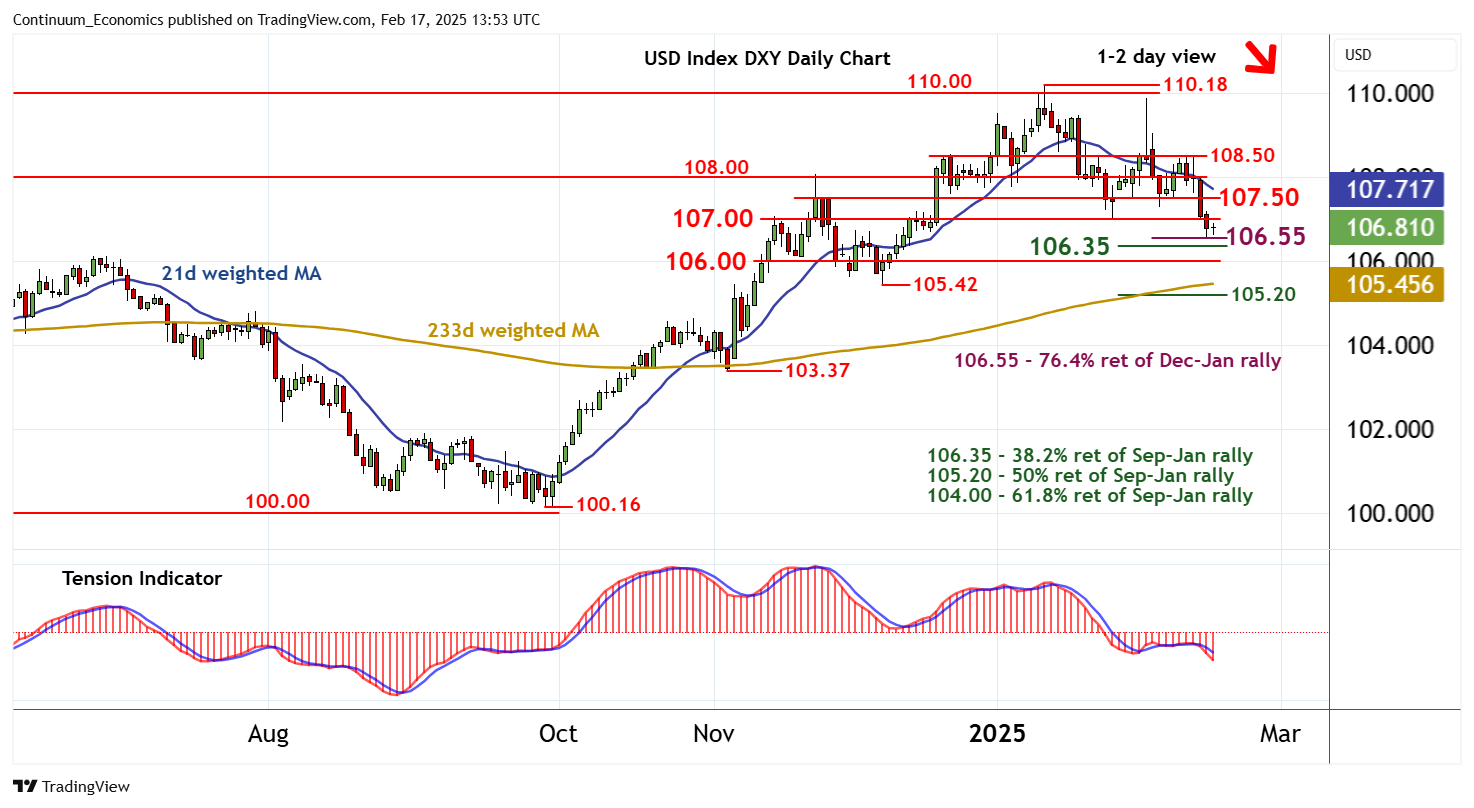
| R4 | 108.50 | minor break level | S1 | 106.55 | ** | 76.4% ret of Dec-Jan rally | ||
| R3 | 108.00 | break level | S2 | 106.35 | ** | 38.2% ret of Sep-Jan rally | ||
| R2 | 107.50 | * | congestion | S3 | 106.00 | ** | congestion | |
| R1 | 107.00 | ** | break level | S4 | 105.42 | ** | 6 Dec (m) low |
Asterisk denotes strength of level
13:35 GMT - The test of strong support at the 106.55 Fibonacci retracement is giving way to consolidation, as intraday studies track higher, with prices currently balanced in cautious trade beneath resistance at 107.00. Daily readings continue to track lower, however, and broader weekly charts are also negative, highlighting a bearish tone and room for further losses in the coming sessions. A later break below 106.55 will extend January losses towards the 106.35 Fibonacci retracement, ahead of congestion around 106.00. Meanwhile, a close above 107.00, if seen, will turn sentiment neutral and give way to consolidation beneath congestion around 107.50.