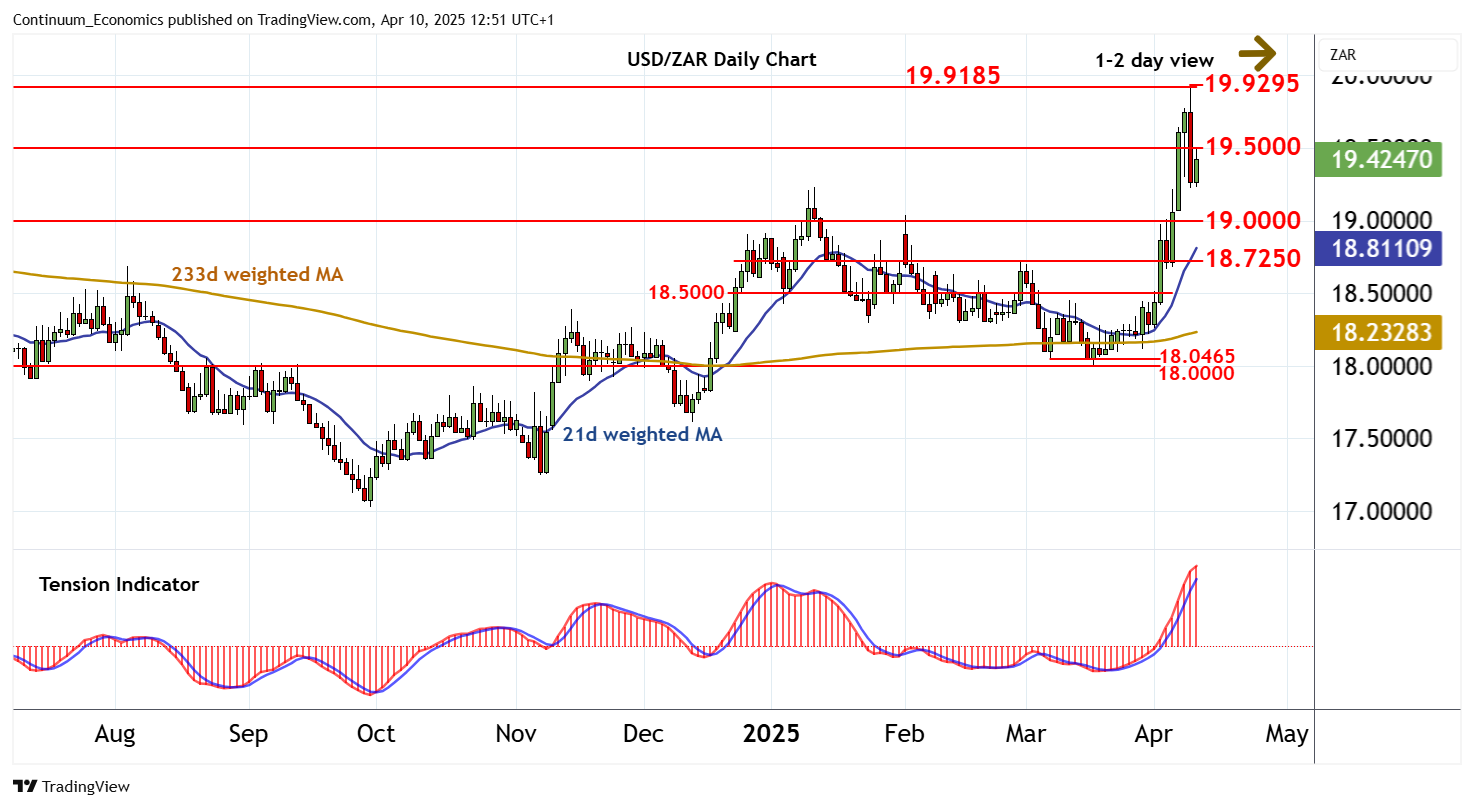
Chart USD/ZAR Update: Sharp pullback from historic high

The test above the 19.9185 year high of May 2023 has posted a fresh all-time high at 19.9185
| Level | Comment | Level | Comment | |||||
|---|---|---|---|---|---|---|---|---|
| R4 | 20.0000 | figure | S1 | 19.0000 | ** | congestion | ||
| R3 | 19.9295 | ** | 9 Apr all-time high | S2 | 18.7250 | * | congestion | |
| R2 | 19.9185 | ** | May 2023 (y) high | S3 | 18.5000 | ** | break level | |
| R1 | 19.5000 | congestion | S4 | 18.5000 | ** | break level |
Asterisk denotes strength of level
12:30 BST - The test above the 19.9185 year high of May 2023 has posted a fresh all-time high at 19.9185. Sharp selling interest has pushed prices down to 19.2250~, where flattening oversold intraday studies are prompting a bounce towards congestion resistance at 19.5000. Overbought daily stochastics are turning down, unwinding negative divergence, suggesting any immediate tests above here could give way to consolidation beneath 19.9185 - 19.9295. But the daily Tension Indicator is rising and broader weekly charts are positive, pointing to potential for a later break above here and fresh highs above 20.0000. Meanwhile, support is down to congestion around 19.0000. A close beneath here would add weight to sentiment and open up further congestion around 18.7250, where renewed buying interest is expected to appear.