Published: 2025-02-11T08:24:53.000Z
Chart GBP/USD Update: Leaning lower

Senior Technical Strategist
1
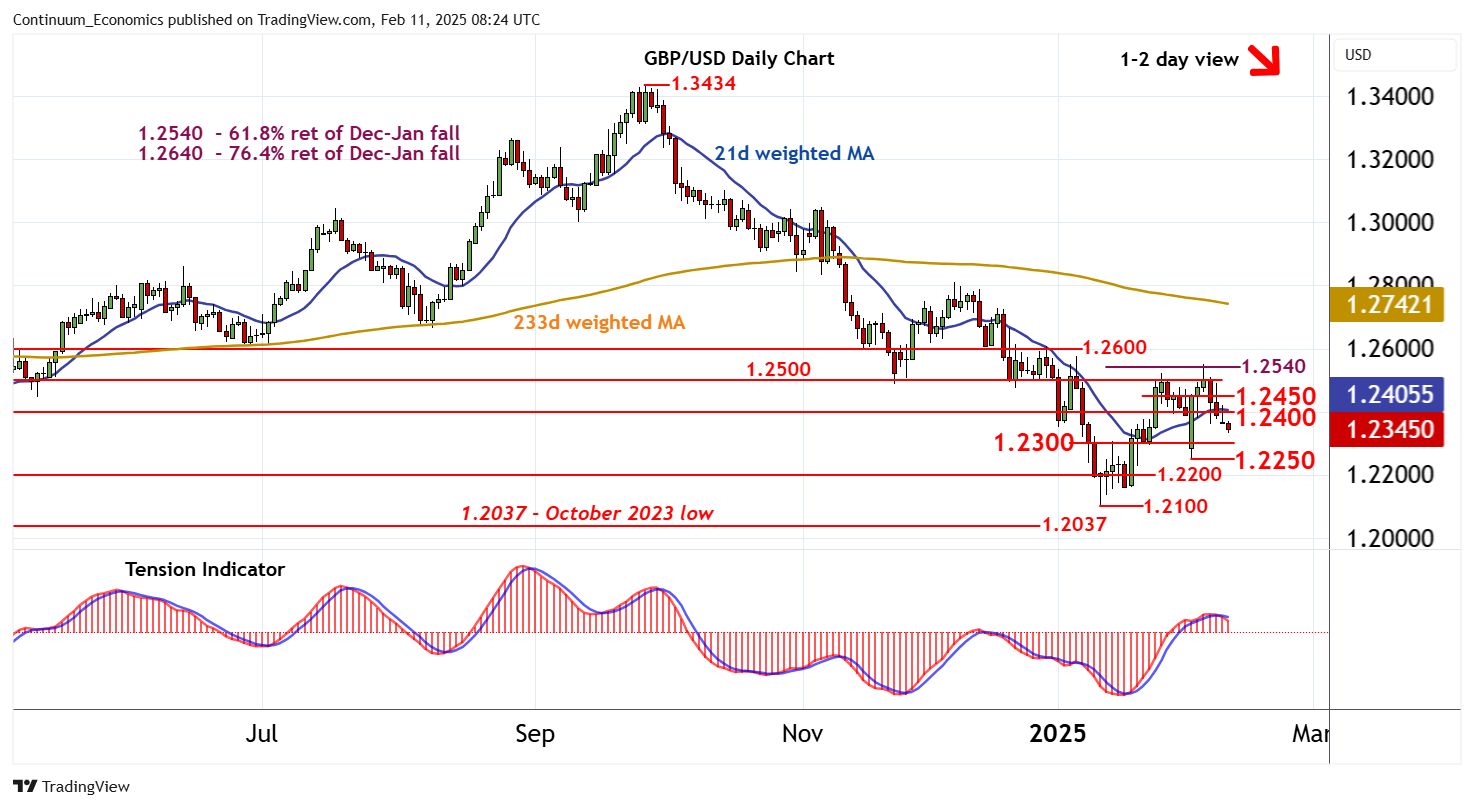
Cautious trade around 1.2400 has given way to the anticipated break lower
| Level | Comment | Level | Comment | |||||
|---|---|---|---|---|---|---|---|---|
| R4 | 1.2540 | ** | 61.8% ret of Dec-Jan fall | S1 | 1.2300 | * | break level | |
| R3 | 1.2500 | * | break level | S2 | 1.2250~ | * | 3 Feb (w) low | |
| R2 | 1.2450 | break level | S3 | 1.2200 | * | congestion | ||
| R1 | 1.2400 | * | congestion | S4 | 1.2200 | * | congestion |
Asterisk denotes strength of level
08:10 GMT - Cautious trade around 1.2400 has given way to the anticipated break lower, with prices currently trading around 1.2350. Intraday studies are flat in oversold areas, suggesting short-term consolidation around here. But daily readings continue track lower, highlighting room for a test of support at 1.2300. Beneath here is the 1.2250~ weekly low of 3 February, but mixed weekly charts are expected to limit any initial tests in consolidation. Meanwhile, a break above congestion resistance at 1.2400, if seen, will turn sentiment neutral and prompt consolidation around 1.2450.