Published: 2026-03-13T15:19:00.000Z
Chart AUD/USD Update: Under pressure
1
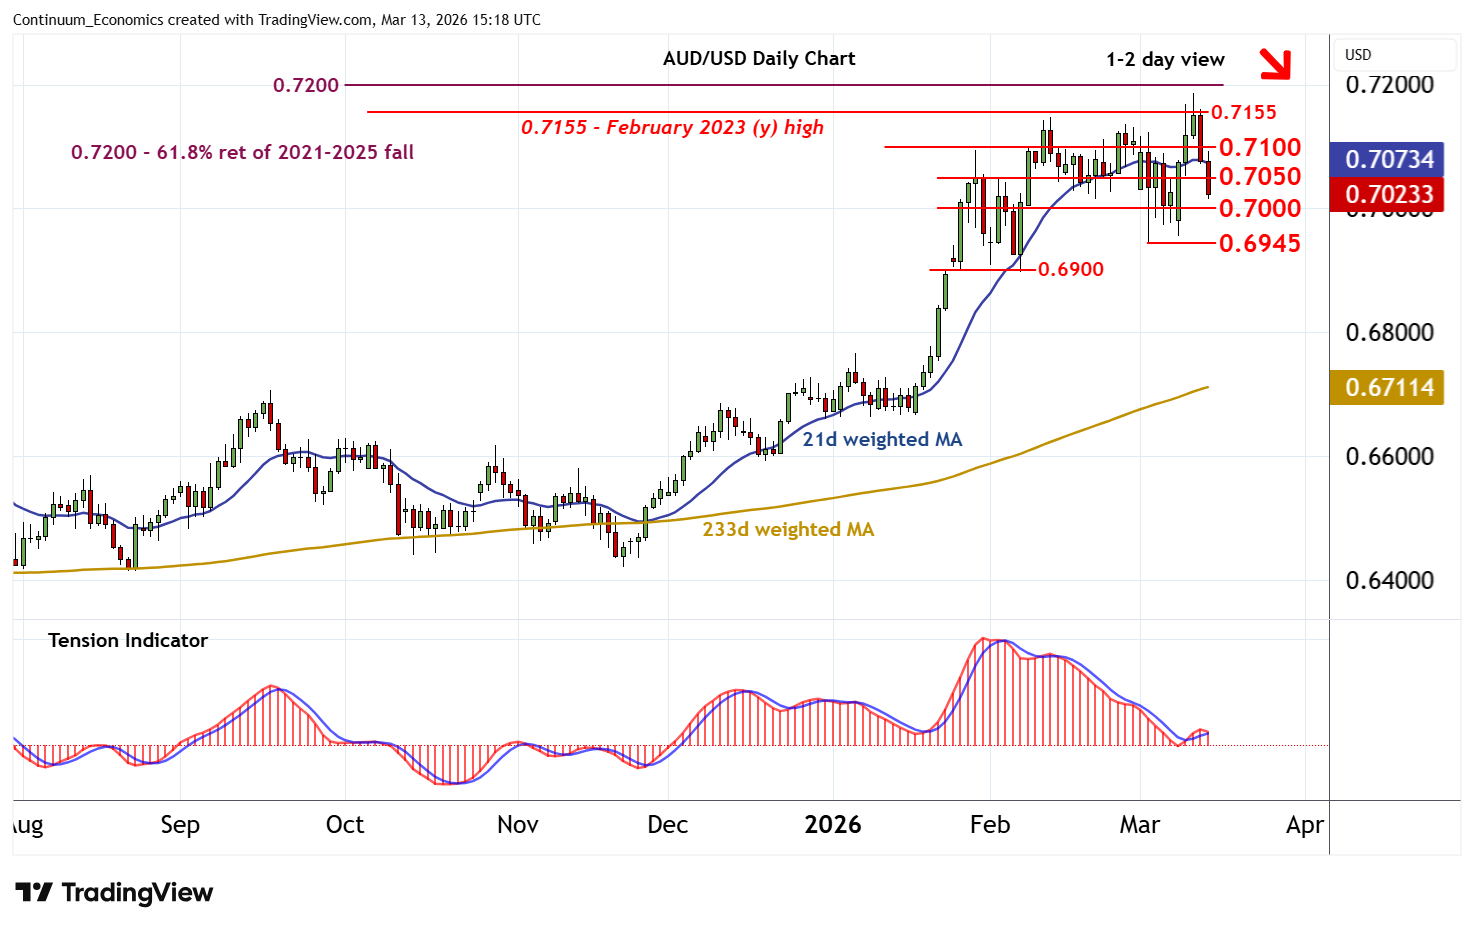
Anticipated losses are extending
| Levels | Imp | Comment | Levels | Imp | Comment | |||
|---|---|---|---|---|---|---|---|---|
| R4 | 0.7185~ | * | 11 Mar YTD high | S1 | 0.7000 | * | congestion | |
| R3 | 0.7155~ | ** | Feb 2023 (y) high | S2 | 0.6945 | ** | 3 Mar (w) low | |
| R2 | 0.7100 | break level | S3 | 0.6900 | ** | break level | ||
| R1 | 0.7050 | * | congestion | S4 | 0.6800 | * | break level |
Asterisk denotes strength of level
14:50 GMT - Anticipated losses are extending, as intraday studies come under pressure, with the break below 0.7050 putting focus on congestion support at 0.7000. Daily readings are under pressure and broader weekly charts are also negative, highlighting room for a break. However, a further close below the 0.6945 weekly low of 3 March is needed to turn sentiment negative and confirm a deeper correction, as focus then turns to 0.6900. Meanwhile, a close back above congestion resistance at 0.7050, if seen, will help to stabilise sentiment and prompt consolidation beneath 0.7100.