Published: 2025-02-21T00:48:16.000Z
Chart NZD/USD Update: Extending gains

Technical Analyst
-
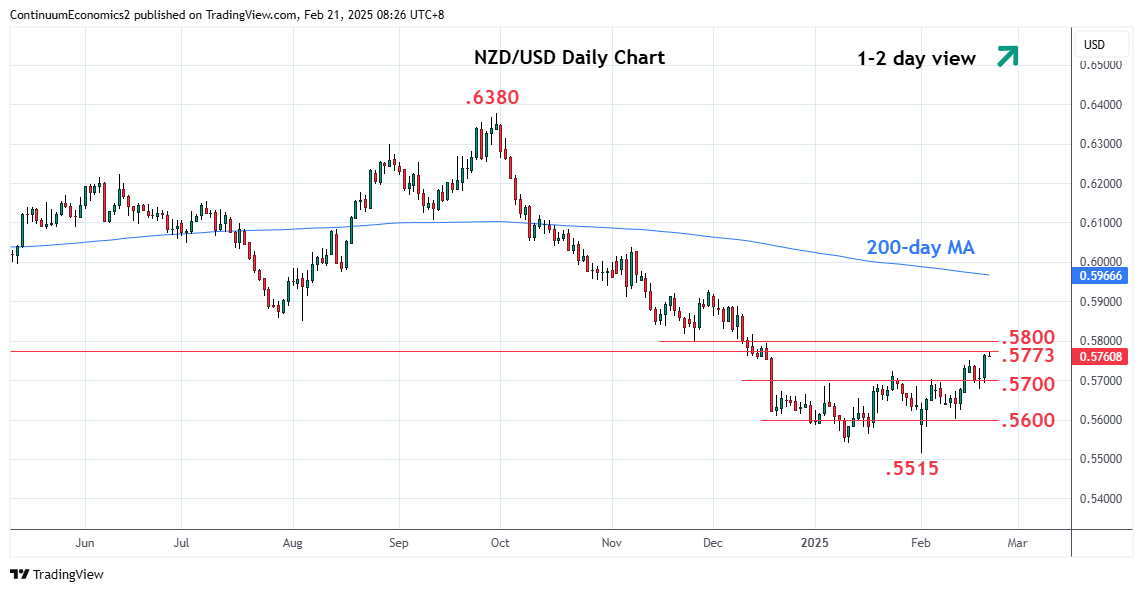
Consolidation at the .5700 level has given way to bounce to break the .5750 high to reach .5773 resistance
| Levels | Imp | Comment | Levels | Imp | Comment | |||
|---|---|---|---|---|---|---|---|---|
| R4 | .5900 | * | congestion | S1 | .5700 | * | congestion | |
| R3 | .5850/60 | ** | Aug low, 38.2% | S2 | .5622/00 | * | 13 Feb low, congestion | |
| R2 | .5800 | * | congestion, Nov low | S3 | .5540 | * | Jan low | |
| R1 | .5773 | * | 2023 year low | S4 | .5515 | ** | 3 Feb YTD low |
Asterisk denotes strength of level
00:40 GMT - Consolidation at the .5700 level has given way to bounce to break the .5750 high to reach .5773 resistance. Pause here see prices unwinding the overbought intraday studies but this is expected to give way to further gains later. Break will further extend gains to retrace losses from the September high and see room to .5800 congestion. Higher still will see extension to the strong resistance at the .5850/60 low of August and 38.2% Fibonacci level. Meanwhile, support at the .5700/.5675 area should now underpin and contain any corrective pullback.