Published: 2025-02-18T08:25:55.000Z
Chart GBP/USD Update: Further consolidation - studies rising

Senior Technical Strategist
2
Little change, as prices extend cautious trade
| Level | Comment | Level | Comment | |||||
|---|---|---|---|---|---|---|---|---|
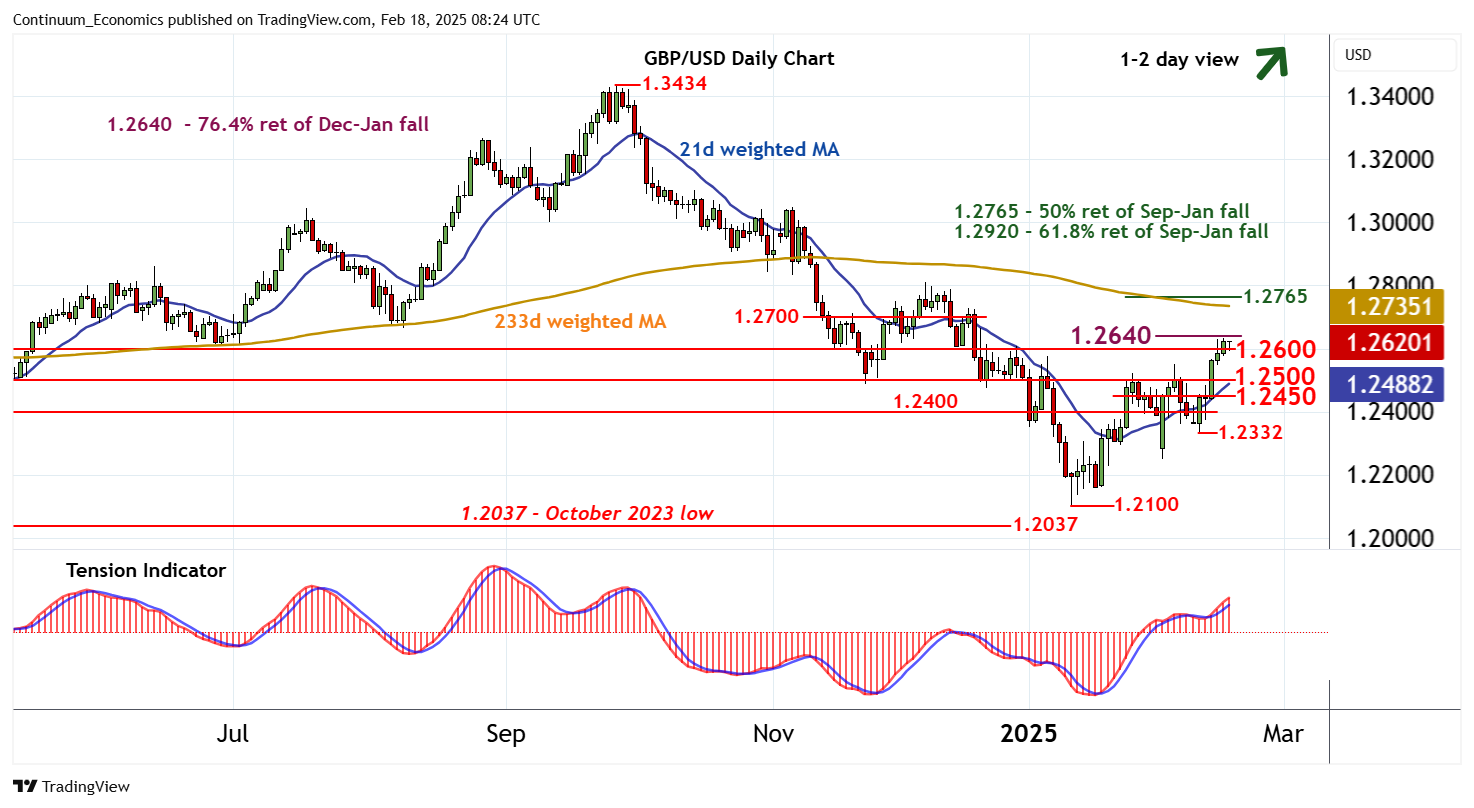
| R4 | 1.2765 | ** | 50% ret of Sep-Jan fall | S1 | 1.2500 | * | break level | |
| R3 | 1.2700 | * | congestion | S2 | 1.2450 | break level | ||
| R2 | 1.2640 | ** | 76.4% ret of Dec-Jan fall | S3 | 1.2400 | * | congestion | |
| R1 | 1.2600 | * | congestion | S4 | 1.2332 | 11 Feb low |
Asterisk denotes strength of level
08:10 GMT - Little change, as prices extend cautious trade within resistance at congestion around 1.2600 and the 1.2640 Fibonacci retracement. Intraday studies are falling, suggesting potential for a test beneath here. But rising daily readings and positive weekly charts are expected to limit scope in renewed buying interest above support at 1.2500. In the coming sessions, higher levels are looked for. However, a close above 1.2640 is needed to turn sentiment positive and extend January gains towards congestion around 1.2700.