Published: 2025-08-22T15:42:44.000Z
Chart USD/CAD Update: Lower in USD-driven trade
0
4
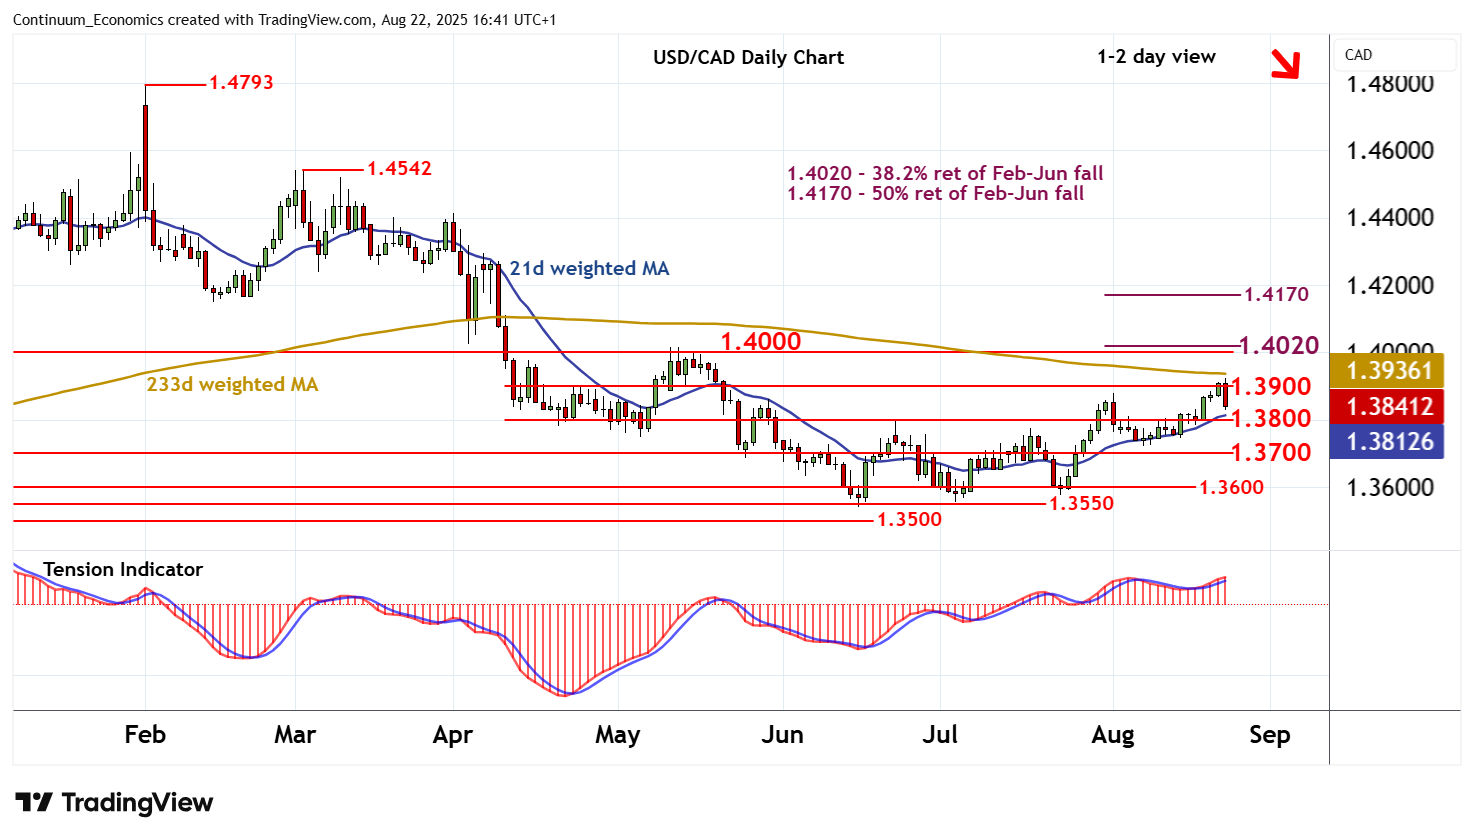
The test of resistance at 1.3900 has been pushed back sharply from 1.3925 in USD-driven trade
| Levels | Imp | Comment | Levels | Imp | Comment | |||
|---|---|---|---|---|---|---|---|---|
| R4 | 1.4200 | ** | congestion | S1 | 1.3800 | * | congestion | |
| R3 | 1.4170 | ** | 50% ret of Feb-Jun fall | S2 | 1.3700 | ** | congestion | |
| R2 | 1.4000/20 | ** | break level; 38.2% ret | S3 | 1.3600 | ** | congestion | |
| R1 | 1.3900 | ** | break level | S4 | 1.3550 | * | congestion |
Asterisk denotes strength of level
16:30 BST - The test of resistance at 1.3900 has been pushed back sharply from 1.3925 in USD-driven trade, with prices currently trading around 1.3840. Intraday studies have turned down and overbought daily stochastics are unwinding, highlighting room for continuation down to congestion support at 1.3800. A further break will add weight to sentiment and open up 1.3600. But the flat daily Tension Indicator and positive weekly charts should limit any initial tests in fresh consolidation. Meanwhile, a close above 1.3900, if seen, will improve price action and extend June gains towards strong resistance at 1.4000/20.