Published: 2026-04-09T02:01:46.000Z
Chart GBP/USD Update: Consolidating test of 1.3480 March high
2
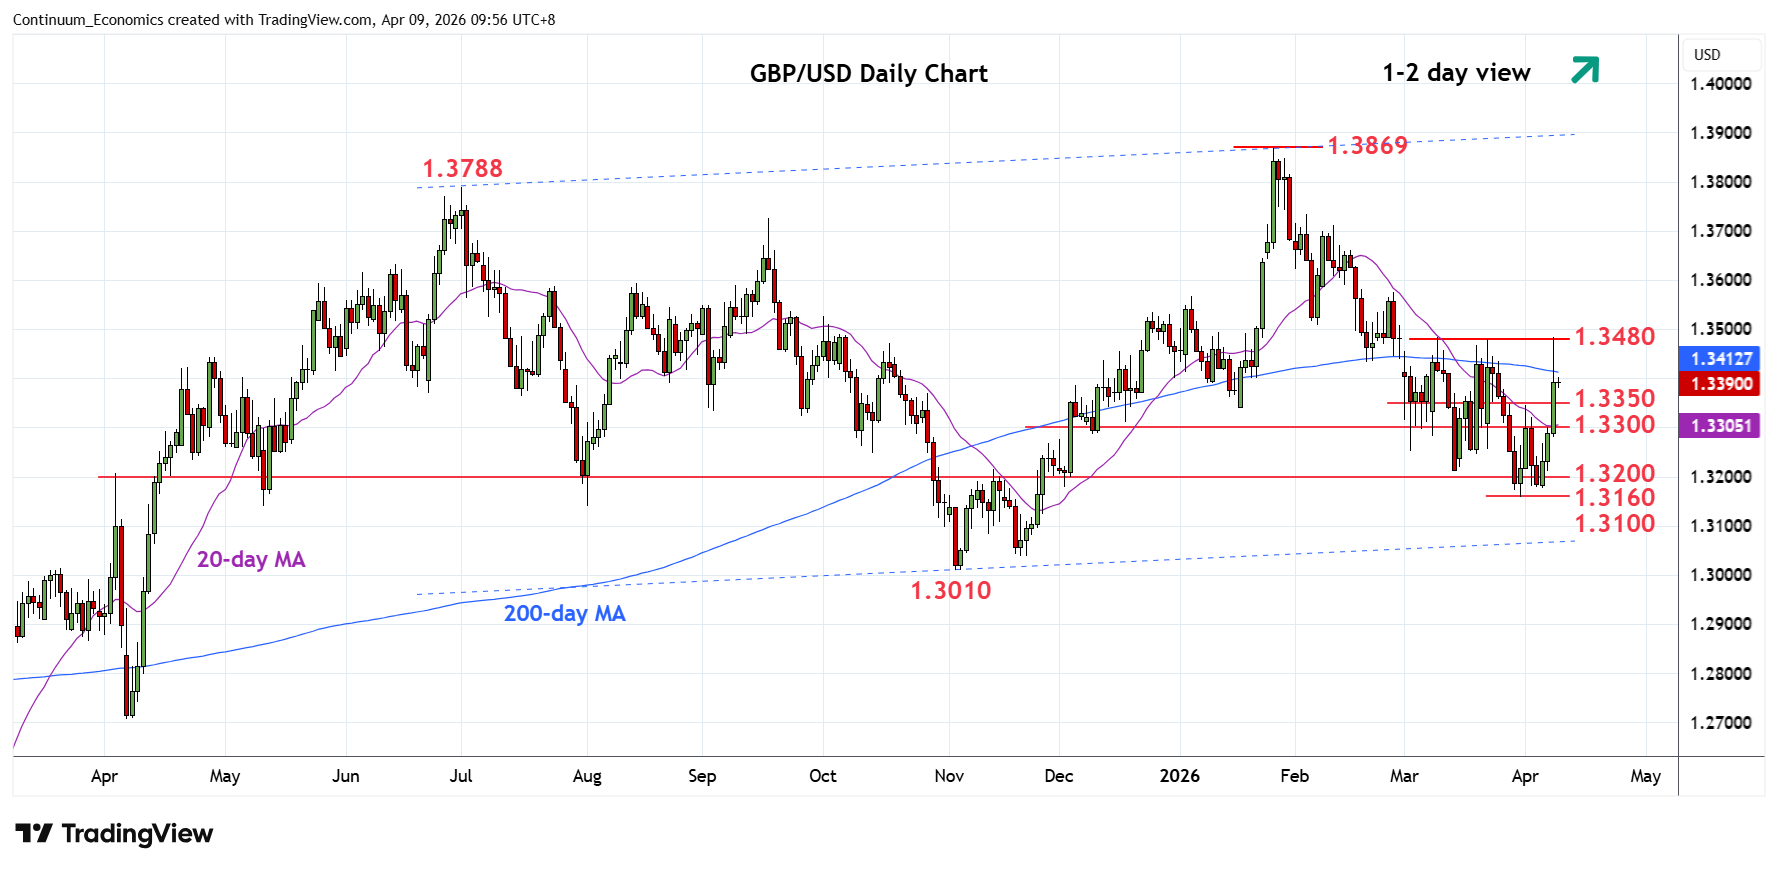
Break above the 1.3400/12 level and 200-day MA saw gains to retest the 1.3480 March high before settling back in consolidation
| Level | Comment | Level | Comment | |||||
|---|---|---|---|---|---|---|---|---|
| R4 | 1.3575 | 26 Feb high | S1 | 1.3350 | congestion | |||
| R3 | 1.3500/10 | ** | congestion, 6 Feb low | S2 | 1.3300 | * | congestion | |
| R2 | 1.3480 | ** | Mar high | S3 | 1.3250 | * | congestion | |
| R1 | 1.3412 | * | 200-day MA | S4 | 1.3210/00 | * | 13 Mar low, congestion |
Asterisk denotes strength of level
02:00 GMT - Break above the 1.3400/12 level and 200-day MA saw gains to retest the 1.3480 March high before settling back in consolidation as prices unwind stretched intraday studies. Positive daily and weekly studies suggest consolidation below the 200-day MA at 1.3412 expected to give way to renewed buying interest later to retrace losses from the January high. Higher, will see room to the strong resistance at the 1.300/10 area. Meanwhile, support is raised to the 1.3350/1.3300 congestion area which should underpin and sustain gains from the 1.3160, 31 March current year low.