Published: 2025-12-03T14:33:30.000Z
Chart USD/JPY Update: Cautious trade - studies under pressure
1
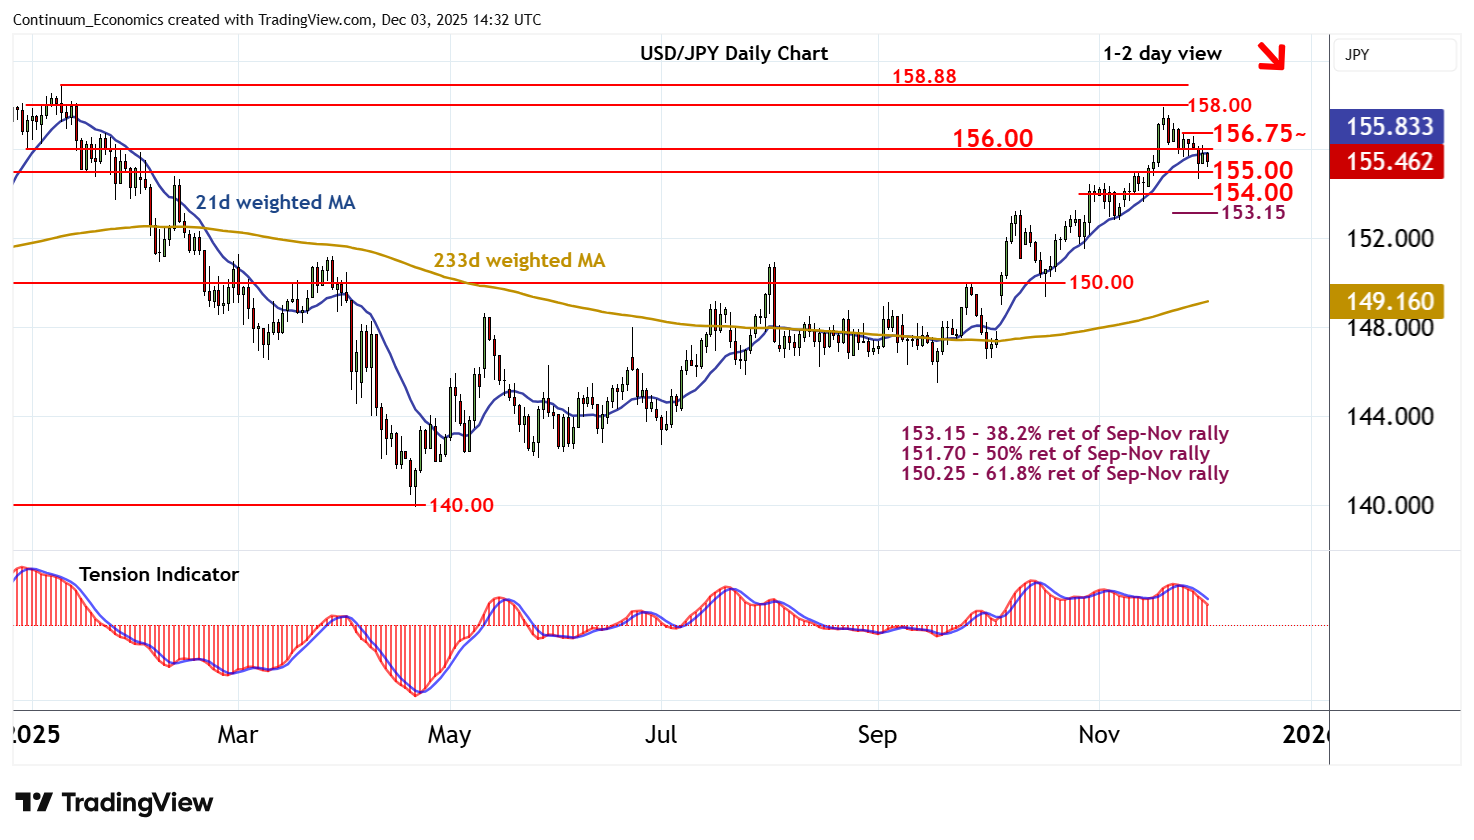
Cautious trade, as prices extend consolidation within the 155.00 - 156.00 range
| Levels | Imp | Comment | Levels | Imp | Comment | |||
|---|---|---|---|---|---|---|---|---|
| R4 | 158.88 | ** | 10 Jan YTD high | S1 | 155.00 | * | break level | |
| R3 | 157.90/00 | * | 20 Nov (w) high; break level | S2 | 154.00 | * | break level | |
| R2 | 156.75 | * | 26 Nov high | S3 | 153.15 | * | 38.2% ret of Sep-Nov rally | |
| R1 | 156.00 | * | congestion | S4 | 153.00 | * | congestion |
Asterisk denotes strength of level
14:15 GMT - Cautious trade, as prices extend consolidation within the 155.00 - 156.00 range. Oversold daily stochastics are turning down and the daily Tension Indicator is negative, highlighting room for fresh losses in the coming sessions. A close below support at 155.00 will add weight to sentiment and extend November losses towards the 154.00 break level. Deteriorating weekly charts highlight potential for further losses towards the 153.15 Fibonacci retracement. Meanwhile, resistance is at congestion around 156.00 and extends to the 156.75 high of 26 November. This range should cap any immediate tests higher.