Published: 2026-04-14T00:26:06.000Z
Chart AUD/USD Update: Pressuring .7100, scope for break
1
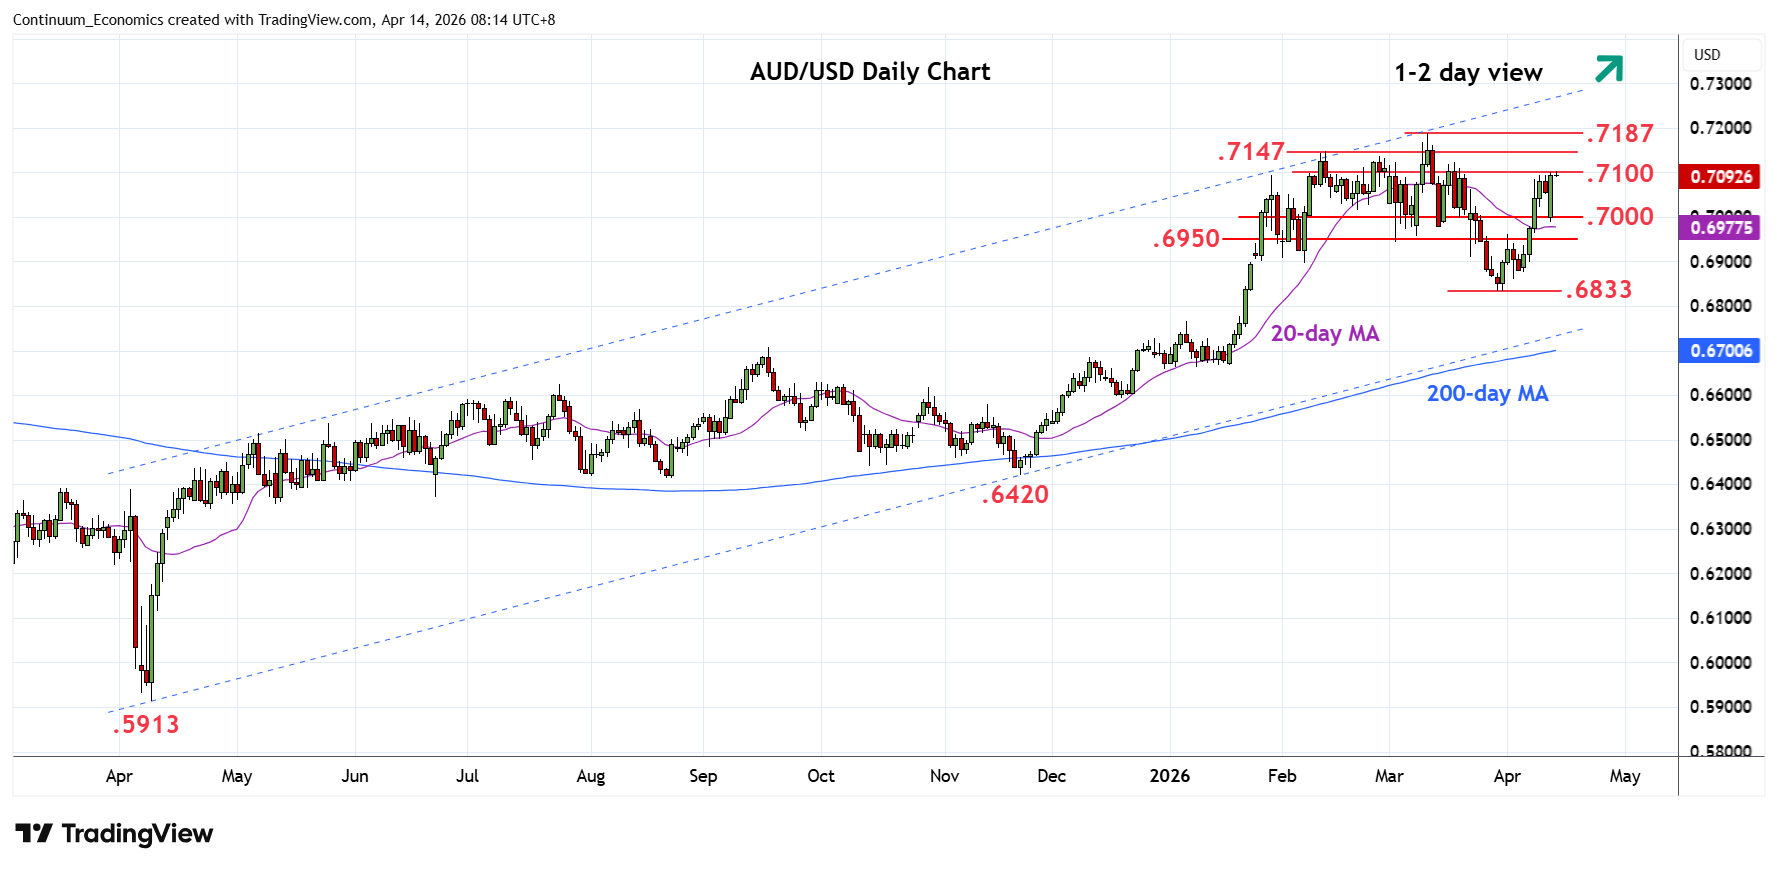
Saw bounce from support at the .7000 congestion to fill the opening gap at .7052 has seen extension to retest the .7100 level
| Levels | Imp | Comment | Levels | Imp | Comment | |||
|---|---|---|---|---|---|---|---|---|
| R4 | 0.7210 | * | 61.8% 2021/2025 fall | S1 | 0.7000 | * | figure, congestion | |
| R3 | 0.7187 | ** | 11 Mar YTD high | S2 | 0.6950 | * | congestion | |
| R2 | 0.7147 | * | Feb high | S3 | 0.6900 | ** | congestion | |
| R1 | 0.7100 | ** | congestion | S4 | 0.6833 | ** | 30 Mar low |
Asterisk denotes strength of level
00:15 GMT - Saw bounce from support at the .7000 congestion to fill the opening gap at .7052 has seen extension to retest the .7100 level. Consolidation here see scope for break to extend gains from the .6833 March low. Higher will see room for retest of the February high at .7147 then the .7187, March current year high. Break here will further extend gains from the April 2025 year low. Meanwhile, support at the .7050/.7000 congestion area should now underpin and sustain gains from the .6833 low.