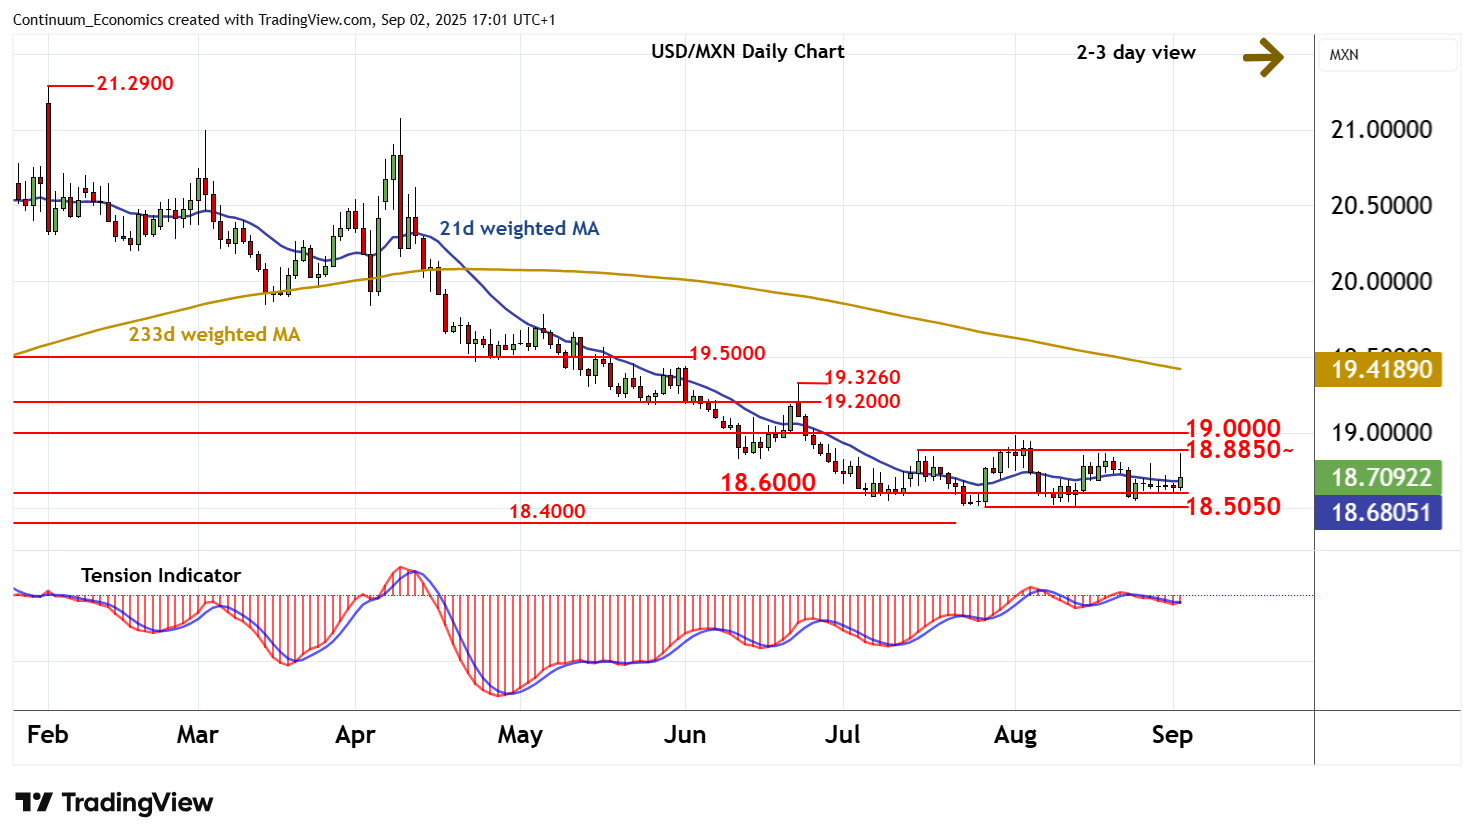
Chart USD/MXN Update: Choppy in range
Consolidation around support at 18.6000 has given way to a sharp bounce

| Levels | Imp | Comment | Levels | Imp | Comment | |||
|---|---|---|---|---|---|---|---|---|
| R4 | 19.3260 | ** | 23 Jun (w) high | S1 | 18.6000 | ** | July-August 2024 break level | |
| R3 | 19.2000 | * | congestion | S2 | 18.5050 | ** | 28 Jul YTD low | |
| R2 | 19.0000 | * | congestion | S3 | 18.4265 | 1 Aug 2024 (m) low | ||
| R1 | 18.8850 | * | 15 Jul (m) high | S4 | 18.4000 | ** | congestion |
Asterisk denotes strength of level
16:35 BST - Consolidation around support at 18.6000 has given way to a sharp bounce, with prices meeting selling interest beneath resistance at the 18.8850 monthly high of 15 July, before settling lower to 18.7200. Both daily and weekly readings are edging higher, suggesting room for a retest of 18.8850. But bearish longer term charts are expected to limit any break in fresh selling interest beneath congestion around 19.0000. A close above here, if seen, will turn sentiment positive and confirm completion of an accumulation base around 18.5050-18.6000. Meanwhile, a close below the 18.5050 current year low of 28 July is needed to turn sentiment outright negative and extend February losses initially towards the 18.4265 monthly low of 1 August 2024.