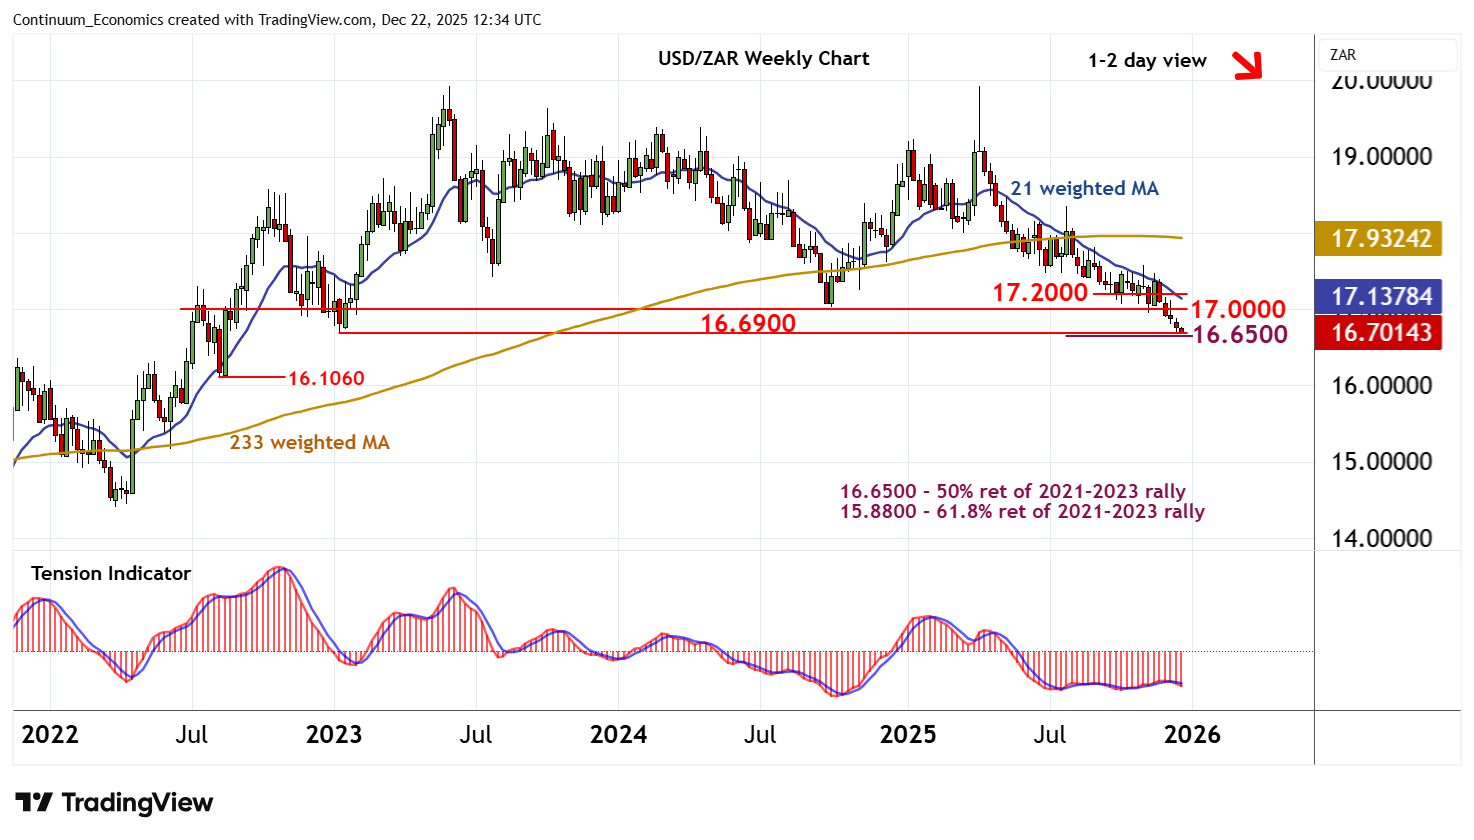
Chart USD/ZAR Update: Another fresh 2025 low
The test below strong support at the 16.6900 year low of January 2023 is giving way to consolidation above the 16.6875 fresh 2025 year low
| Level | Comment | Level | Comment | |||||
|---|---|---|---|---|---|---|---|---|
| R4 | 17.5000 | ** | congestion | S1 | 16.6900 | ** | January 2023 (y) low | |
| R3 | 17.4000 | * | congestion | S2 | 16.6875 | fresh 2025 (y) low | ||
| R2 | 17.2000 | * | congestion | S3 | 16.6500 | ** | 50% ret of 2021-2023 rally | |
| R1 | 17.0000 | ** | congestion | S4 | 16.1060 | ** | August 2022 low |
Asterisk denotes strength of level
12:15 GMT - The test below strong support at the 16.6900 year low of January 2023 is giving way to consolidation above the 16.6875 fresh 2025 year low, as oversold daily stochastics edge higher. However, the daily Tension Indicator remains negative and broader weekly charts are bearish, highlighting difficulty sustaining gains, with fresh selling interest to appear into any bounce towards congestion resistance at 17.0000. Following cautious trade, fresh losses are looked for. A later close below 16.6900 will extend April losses towards the 16.6500 Fibonacci retracement. However, already oversold weekly stochastics could limit any initial tests in short-covering/consolidation.