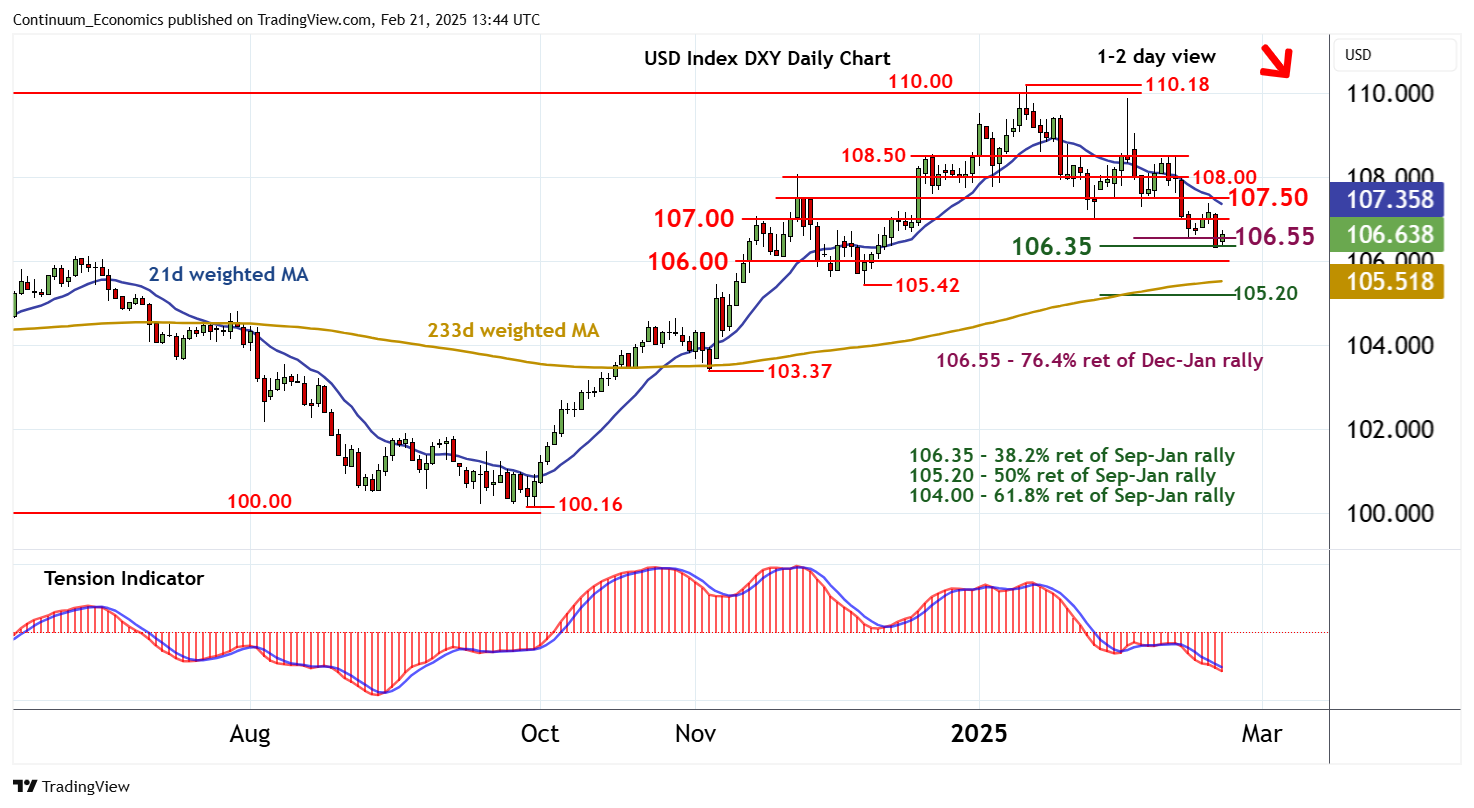
Chart USD Index DXY Update: Consolidating test of 106.35/55 - studies under pressure

The test of support at the 106.55 Fibonacci retracement has given way to a break to the 106.35 longer-term Fibonacci retracement
| Levels | Imp | Comment | Levels | Imp | Comment | |||
|---|---|---|---|---|---|---|---|---|
| R4 | 108.50 | minor break level | S1 | 106.55 | ** | 76.4% ret of Dec-Jan rally | ||
| R3 | 108.00 | break level | S2 | 106.35 | ** | 38.2% ret of Sep-Jan rally | ||
| R2 | 107.50 | * | congestion | S3 | 106.00 | ** | congestion | |
| R1 | 107.00 | ** | break level | S4 | 105.42 | ** | 6 Dec (m) low |
Asterisk denotes strength of level
13:30 GMT - The test of support at the 106.55 Fibonacci retracement has given way to a break to the 106.35 longer-term Fibonacci retracement, where unwinding oversold intraday studies are prompting a bounce to 106.65. Oversold daily stochastics are flattening, suggesting room for consolidation above this area. But the negative daily Tension Indicator and bearish weekly charts are expected to prompt fresh selling interest. A later break below 106.35/55 will add weight to sentiment and extend January losses towards congestion around 106.00. Meanwhile, an unexpected close above resistance at 107.00 will turn sentiment neutral and prompt consolidation beneath congestion around 107.50.