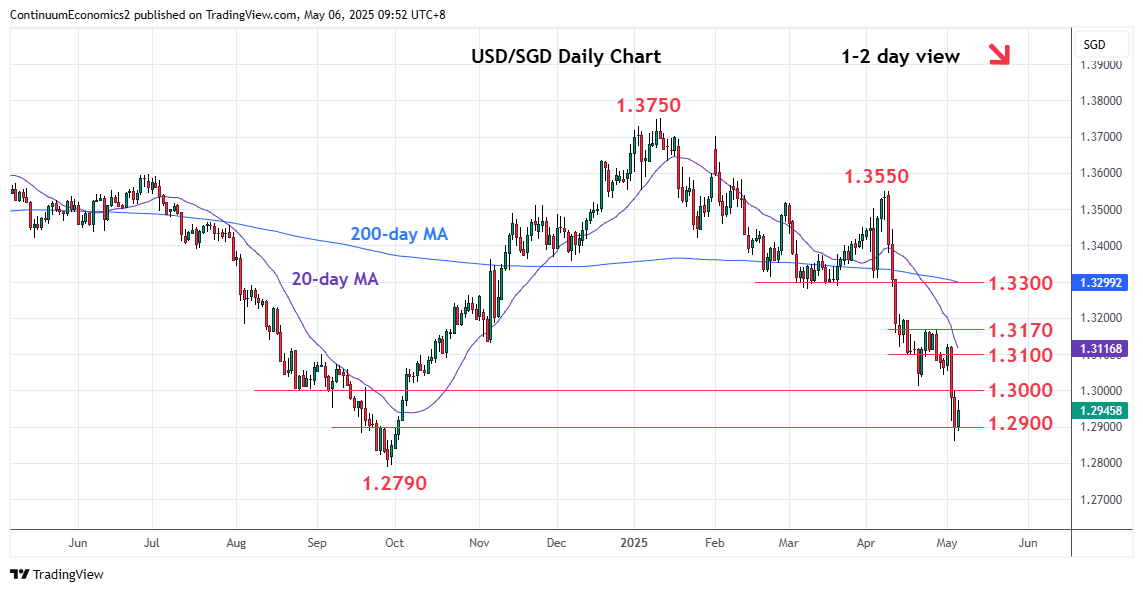
Chart USD/SGD Update: Range-bound in consolidation

No follow-through on break of the 1.2900 level as prices turned up from fresh year low at 1.2861
| Level | Comment | Level | Comment | ||||
|---|---|---|---|---|---|---|---|
| R4 | 1.3170 | ** | 23 Apr high | S1 | 1.2900 | * | congestion |
| R3 | 1.3100/30 | * | congestion, 1 May high | S2 | 1.2861 | ** | 5 May YTD low |
| R2 | 1.3050 | * | congestion | S3 | 1.2790 | ** | Sep 2024 multi-year low |
| R1 | 1.3000/10 | ** | congestion, Apr low | S4 | 1.2705 | * | 29 Oct 2014 low |
Asterisk denotes strength of level
02:10 GMT - No follow-through on break of the 1.2900 level as prices turned up from fresh year low at 1.2861. Bounce here see prices unwinding the oversold intraday studies but further losses cannot be ruled out to target the 1.2790, September 2024 multi-year low. Would expect reaction on retest of the latter as weekly studies are oversold and caution corrective bounce retrace steep drop from the 1.3550, April high. Meanwhile, resistance is at the 1.3000/10 congestion and April low which is expected to cap. Above here will open up room for stronger corrective bounce to the 1.3050 congestion and 1.3100/30 resistance.