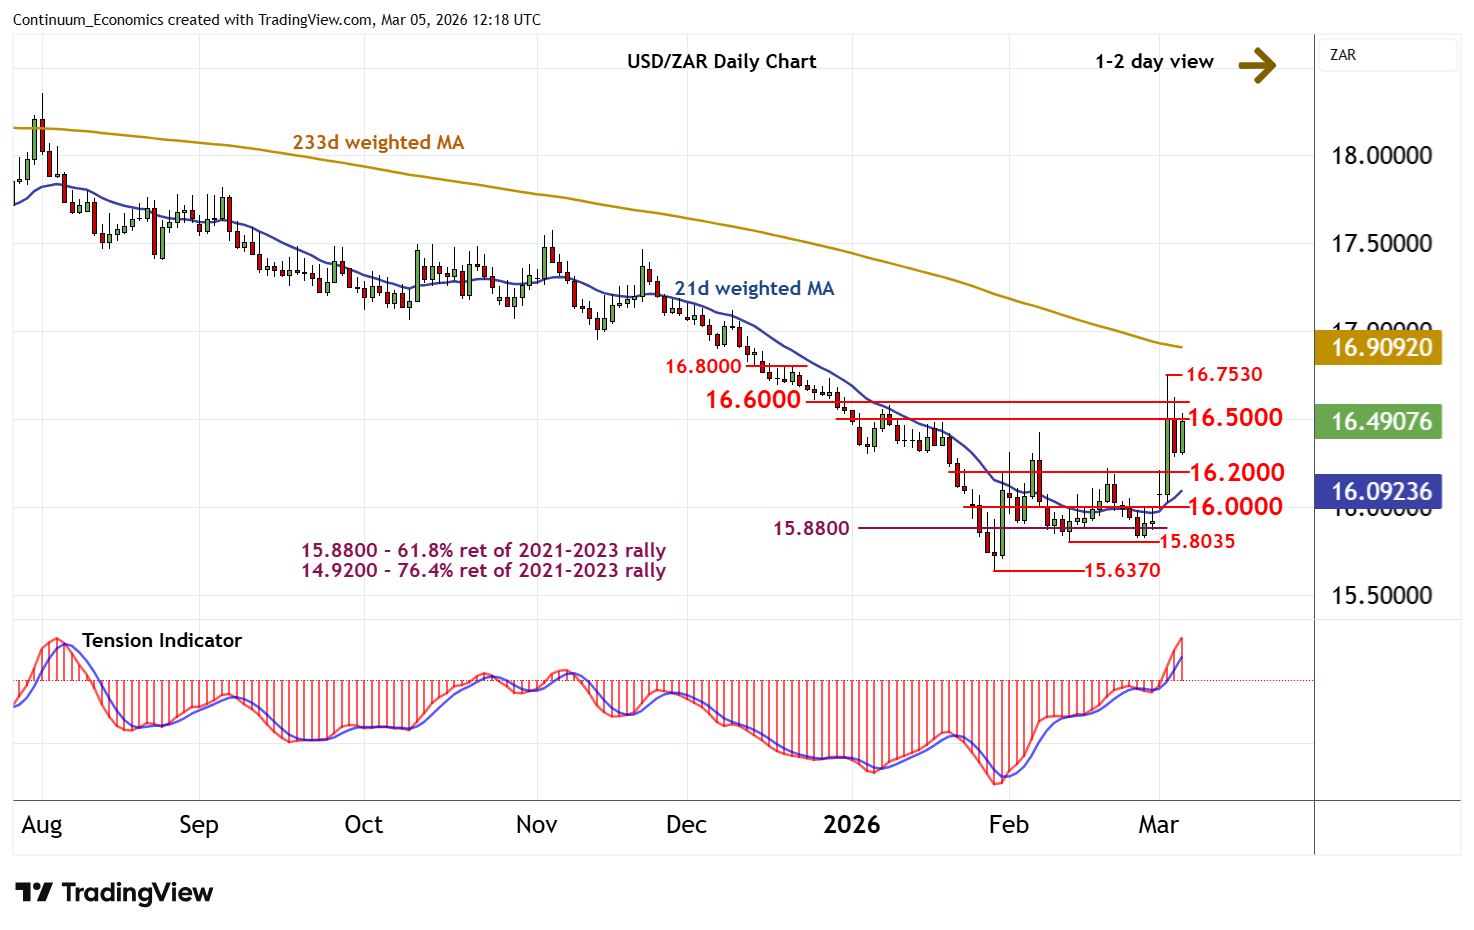
Chart USD/ZAR Update: Cautious trade - background improving
Minor losses have bounced from 16.2850, as oversold intraday studies unwind
| Level | Comment | Level | Comment | |||||
|---|---|---|---|---|---|---|---|---|
| R4 | 16.8000 | * | break level | S1 | 16.2000 | * | congestion | |
| R3 | 16.7530 | 3 Mar high | S2 | 16.0000 | ** | congestion | ||
| R2 | 16.6000 | break level | S3 | 15.8035 | ** | 12 Feb (m) low | ||
| R1 | 16.5000 | break level | S4 | 15.6370 | ** | 29 Jan YTD low |
Asterisk denotes strength of level
12:10 GMT - Minor losses have bounced from 16.2850, as oversold intraday studies unwind, with prices currently pressuring resistance at 16.5000. Overbought daily stochastics are ticking lower, suggesting a cautious tone and potential for further consolidation beneath here. But the rising daily Tension Indicator and positive weekly charts point to room for later gains. A close above resistance within the 16.5000 - 16.6000 range would turn sentiment positive and extend late-January gains beyond the 16.7530 high of 3 March, initially towards 16.8000. Meanwhile, support remains at congestion around 16.2000 and should underpin any immediate setbacks.