Published: 2026-04-15T00:28:31.000Z
Chart AUD/USD Update: Consolidating test of February high
1
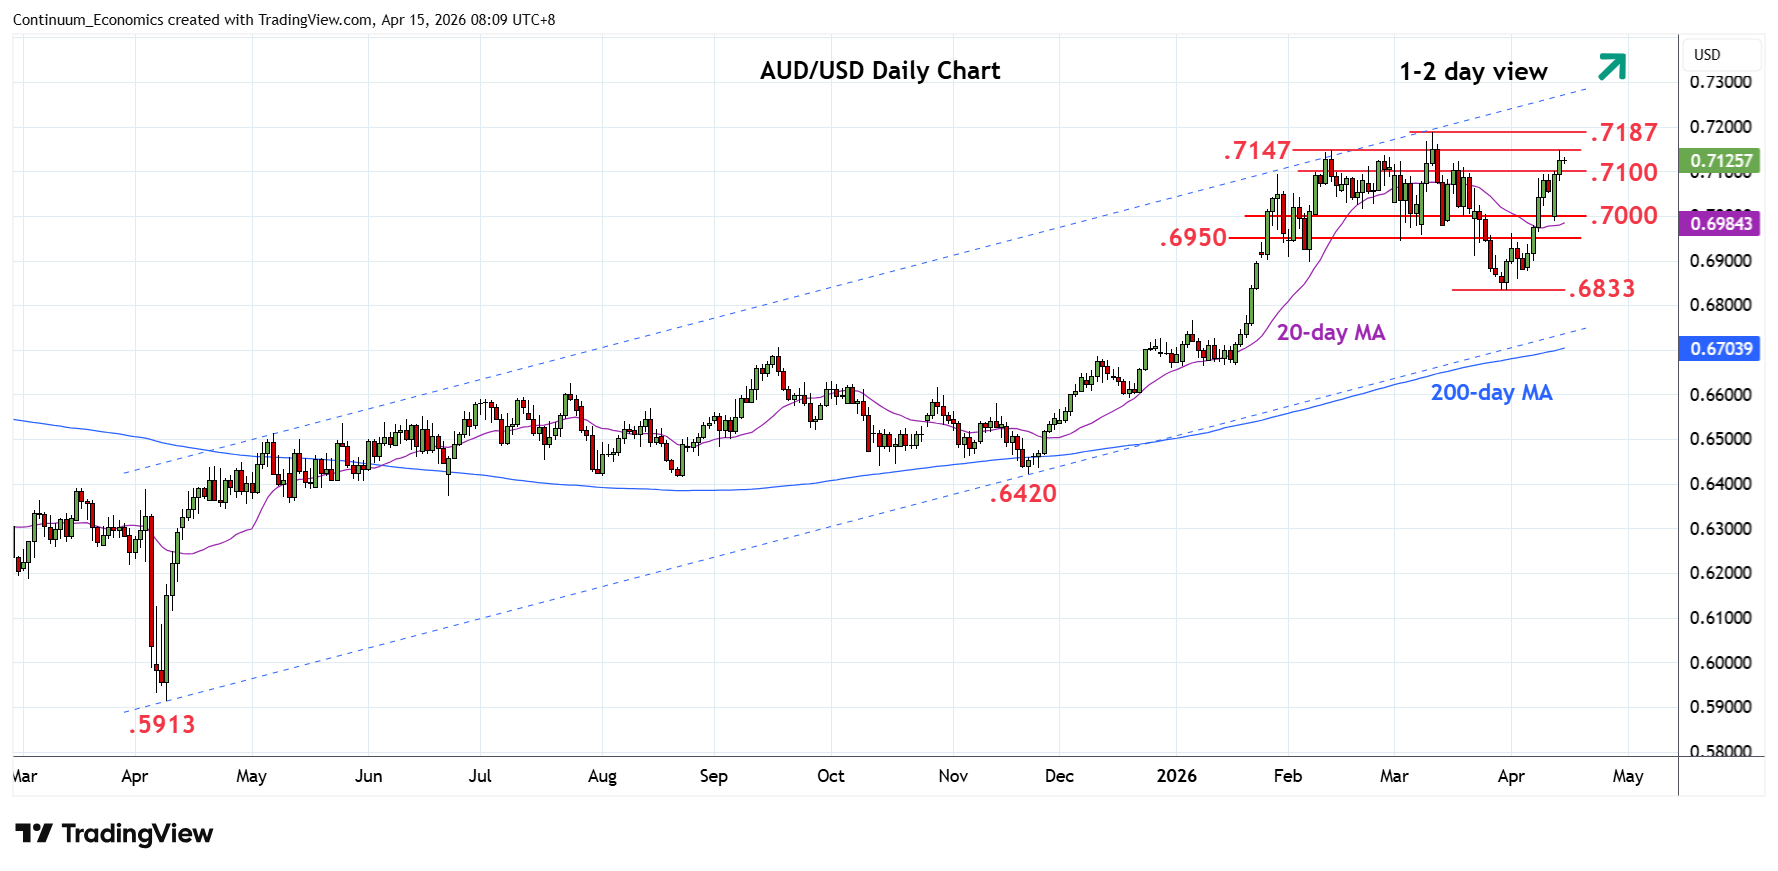
Break above the the .7100 level has seen gains to tag the .7147 February high
| Levels | Imp | Comment | Levels | Imp | Comment | |||
|---|---|---|---|---|---|---|---|---|
| R4 | 0.7280 | * | Jun 2022 high | S1 | 0.7100 | * | congestion | |
| R3 | 0.7210 | * | 61.8% 2021/2025 fall | S2 | 0.7050 | * | congestion | |
| R2 | 0.7187 | ** | 11 Mar YTD high | S3 | 0.7000 | ** | figure, congestion | |
| R1 | 0.7147 | * | Feb high | S4 | 0.6950 | ** | congestion |
Asterisk denotes strength of level
00:20 GMT - Break above the the .7100 level has seen gains to tag the .7147 February high before giving way to consolidation as daily studies stretches into overbought areas. Break here will see room to retest the .7187 March current year high and further extend the underlying bull trend from the April 2025 year low. Meanwhile, support is at the .7100/.7050 congestion area which should underpin. Below this will ease the upside pressure and leave the way open up deeper pullback to strong support at the .7000/.6950 area.