Published: 2025-11-21T00:36:42.000Z
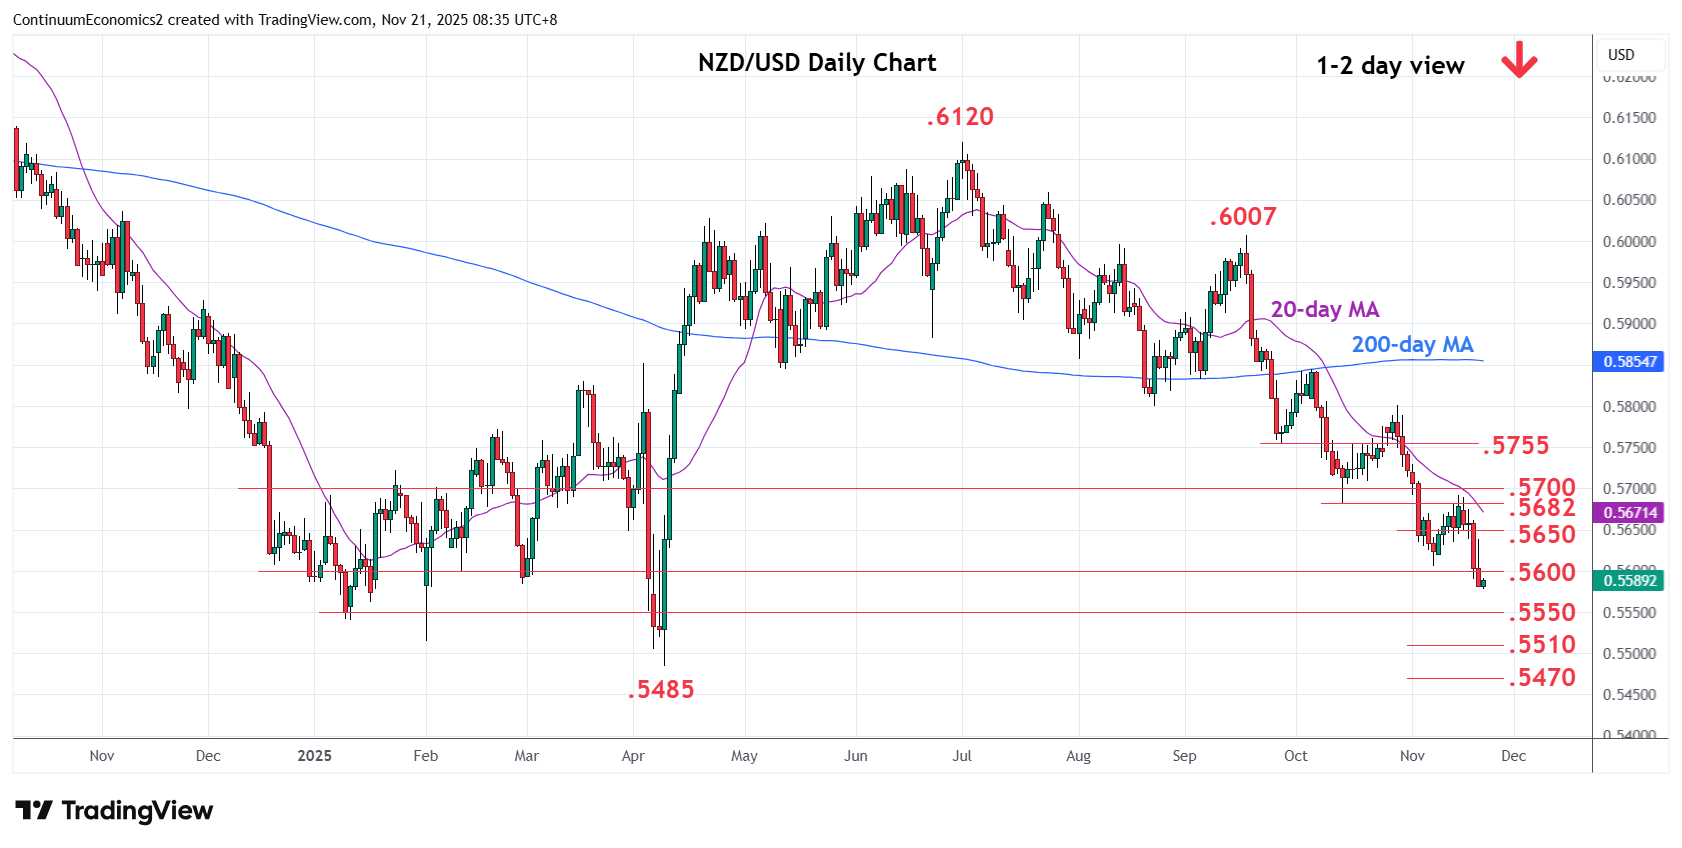
Chart NZD/USD Update: Room to extend losses
-
Still under pressure and break of the .5600 level see room for further slide to the .5550/40 congestion area and January low
| Levels | Imp | Comment | Levels | Imp | Comment | |||
|---|---|---|---|---|---|---|---|---|
| R4 | .5755 | ** | Sep low | S1 | .5550/40 | * | congestion, Jan low | |
| R3 | .5700 | * | congestion | S2 | .5510 | * | Oct 2022 year low | |
| R2 | .5650 | * | congestion | S3 | .5485 | ** | 9 Apr YTD low | |
| R1 | .5606 | * | 7 Nov low | S4 | .5470 | ** | Mar 2020 year low |
Asterisk denotes strength of level
00:30 GMT - Still under pressure and break of the .5600 level see room for further slide to the .5550/40 congestion area and January low. Below this will turn focus to the series of lows starting with October 2022 year low at .5510 though scope will be for retest of the .5485, 9 April current year low. Just below this will see room to .5470, 2020 year low. Would expect reaction at these lows as weekly studies remains deep in oversold areas. Meanwhile, resistance is lowered to the .5600/06 area. Above here will open up room for corrective bounce to .5650/.5700 congestion.