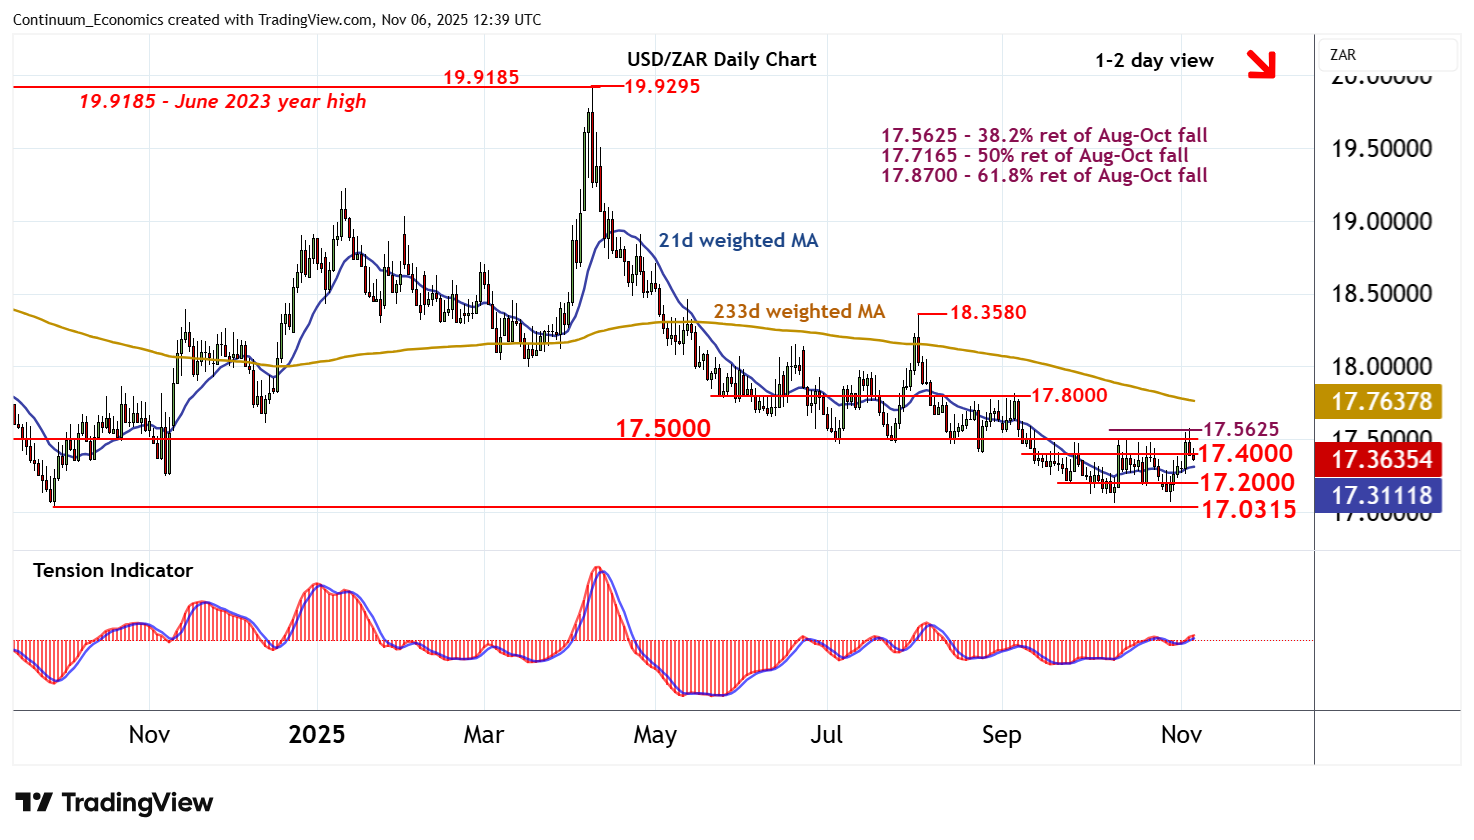
Chart USD/ZAR Update: Higher levels not sustained
The retest of strong resistance within congestion around 17.5000 and the 17.5625 Fibonacci retracement has given way to a pullback
| Level | Comment | Level | Comment | |||||
|---|---|---|---|---|---|---|---|---|
| R4 | 17.8000 | break level | S1 | 17.2000 | * | congestion | ||
| R3 | 17.5625 | ** | 38.2% ret of Aug-Oct fall | S2 | 17.0630 | * | 9 Oct YTD low | |
| R2 | 17.5000 | ** | congestion | S3 | 17.0315 | ** | 30 Sep 2024 (y) low | |
| R1 | 17.4000 | * | congestion | S4 | 17.0000 | ** | congestion |
Asterisk denotes strength of level
12:10 GMT - The retest of strong resistance within congestion around 17.5000 and the 17.5625 Fibonacci retracement has given way to a pullback, as intraday studies turn down, with prices once again trading below 17.4000. Overbought daily stochastics are unwinding, highlighting room for continuation down to congestion support at 17.2000. But the rising daily Tension Indicator and positive weekly charts should limit any initial tests in renewed buying interest/consolidation. Following cautious trade, fresh gains are looked for. But a close above 17.5625 is needed to turn sentiment positive and extend October gains towards 17.8000.