Continuum Economics
  • Search
  • About Us
  • Buy
  • Invite A Friend
  • My Basket
  • Articles
  • Calendar
  • Forecasts
  • Events
  • Data
  • Newsletters
  • My Alerts
  • Community
  • Directory
  • About Us
  • Buy
  • Invite A Friend
  • My Basket
  • Articles
    • All
    • Thematic
    • Tactical
    • Asia
    • EMEA
    • Americas
    • Newsletters
    • Freemium
    • Editor's Choice
    • Most Viewed
    • Most Shared
    • Most Liked
  • Calendar
    • Interactive
      • China
      • United States
      • Eurozone
      • United Kingdom
    • Month Ahead
    • Reviews
    • Previews
  • Forecasts
    • Forecasts
    • Key Views
  • Events
    • Media
    • Conference Calls
  • Data
    • Country Insights
    • Shadow Credit Ratings
    • Full CI Data Download
  • Newsletters
  • My Alerts
  • Community
    • FX
    • Fixed Income
    • Macro Strategy
    • Credit Markets
    • Equities
    • Commodities
    • Precious Metals
    • Renewables
  • Directory
  • My Account
  • Notifications Setup
  • Account Details
  • Recent Devices
  • Distribution Lists
  • Shared Free Trials
  • Saved Articles
  • Shared Alerts
  • My Posts
Published: 2025-06-11T02:54:37.000Z

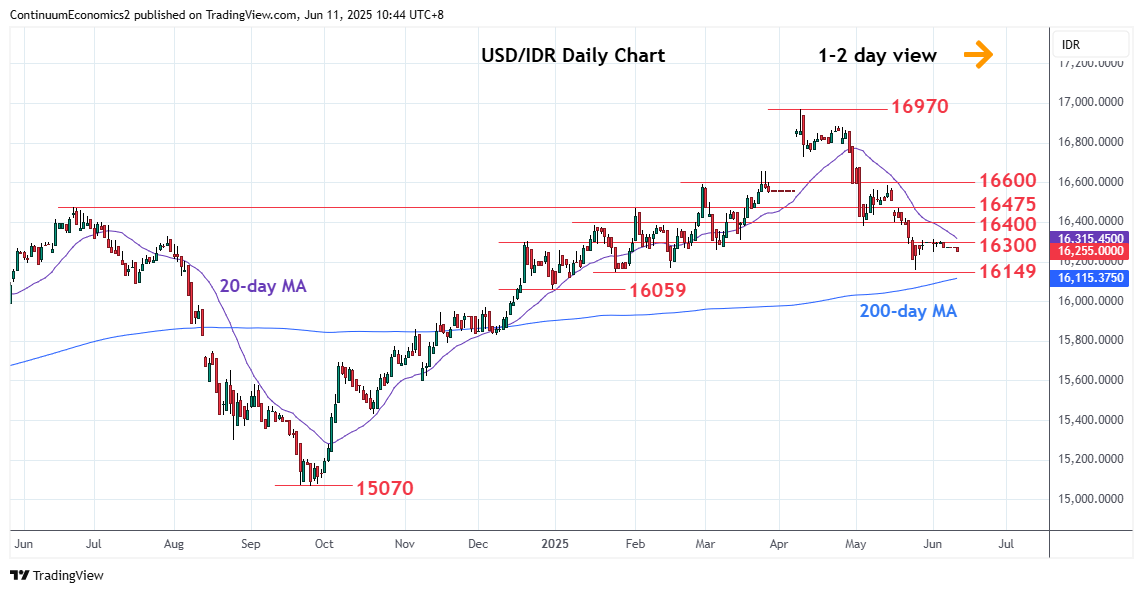
Chart USD/IDR Updates: Leaning lower below 16300 congestion

byPakLai Ng

Technical Analyst
-

Little change, as prices drift narrowly below the 16300 resistance

 LevelsImpComment  LevelsImpComment
R416584/600**14 May high, congestion S116149*24 Jan low
R316475*Jun 2024 year high S216124*7 Jan YTD low
R216400*congestion S316059*31 Dec low
R116300*congestion S416019*50% Sep/Apr rally           

Asterisk denotes strength of level

02:50 GMT - Little change, as prices drift narrowly below the 16300 resistance. Daily studies have turned mixed and see room for pullback to the 16200 level. Below this will expose support at the 16169/16149 lows to retest. Break here will see room for deeper pullback to retrace the September/April rally to retest 7 January YTD low at 16124. Lower still, will target the 16059 support and 16019, 50% Fibonacci level. Meanwhile, congestion at 16300 is expected to cap. Break here, if seen, will see room for stronger gains to retrace losses from the 16970 April YTD high to the 16400/16475 area.

Continue to read the article for free
Login

or

or

Topics
USD/IDR-TA
EM-Technical
Technical Analysis

GENERAL

  • Home
  • About Us
  • Our Team
  • Careers

LEGAL

  • Terms and Conditions
  • Privacy Policy
  • Compliance
  • GDPR

GET IN TOUCH

  • Contact Us
Continuum Economics
The Technical Analyst Awards Winner 2021
The Technical Analyst Awards Finalist 2020
image