Published: 2026-02-06T00:23:29.000Z
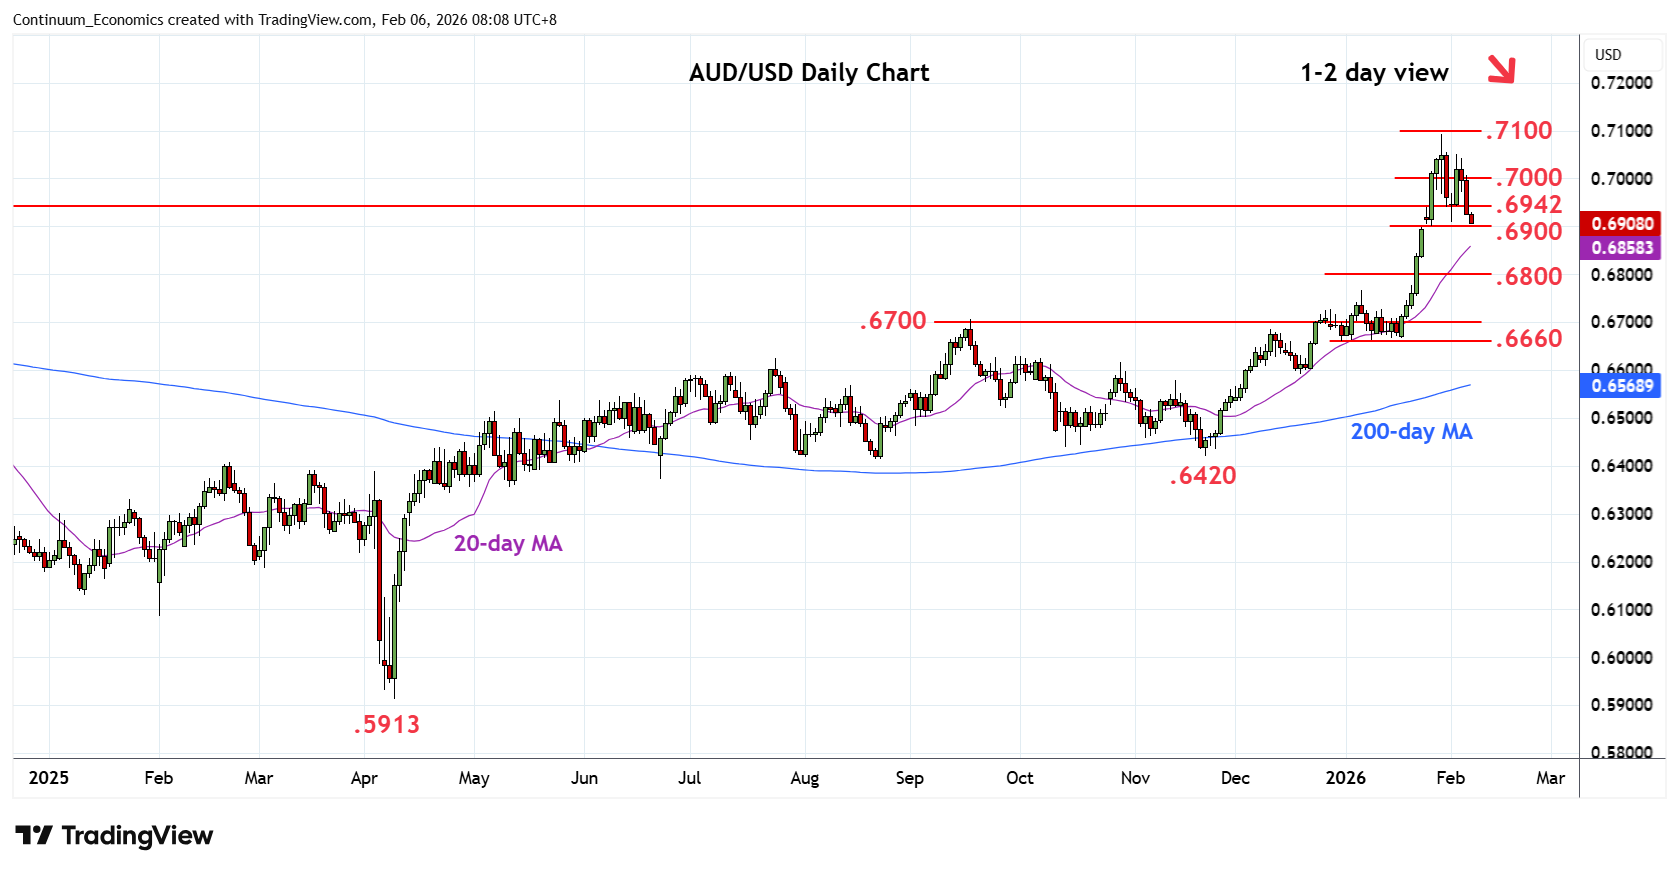
Chart AUD/USD Update: Under pressure, room for deeper pullback
-
Break of the .6942 support see pressure returning to support at the .6900 level
| Levels | Imp | Comment | Levels | Imp | Comment | |||
|---|---|---|---|---|---|---|---|---|
| R4 | 0.7094 | ** | 29 Jan YTD high | S1 | 0.6900 | ** | 23 Jan high, gap | |
| R3 | 0.7050 | * | 3 Feb high | S2 | 0.6835 | * | 38.2% Nov/Jan rally | |
| R2 | 0.7000 | * | congestion | S3 | 0.6800 | * | congestion | |
| R1 | 0.6942 | * | 2024 year high | S4 | 0.6766/60 | * | 7 Jan high, 50% |
Asterisk denotes strength of level
00:15 GMT - Break of the .6942 support see pressure returning to support at the .6900 level. Daily studies are tracking lower from overbought areas and suggest scope for break here to will see room for deeper pullback to retrace gains from the November low. Lower will see extension to the .6850 congestion and .6835, 38.2% Fibonacci level. Lower still, will see room to the .6800/.6760 area and 50% Fibonacci level. Meanwhile, resistance is lowered to the .6942 resistance, now expected to cap and sustain losses from the .7050/.7094 highs.