Published: 2026-01-14T08:48:09.000Z
Chart EUR/USD Update: Leaning lower
2
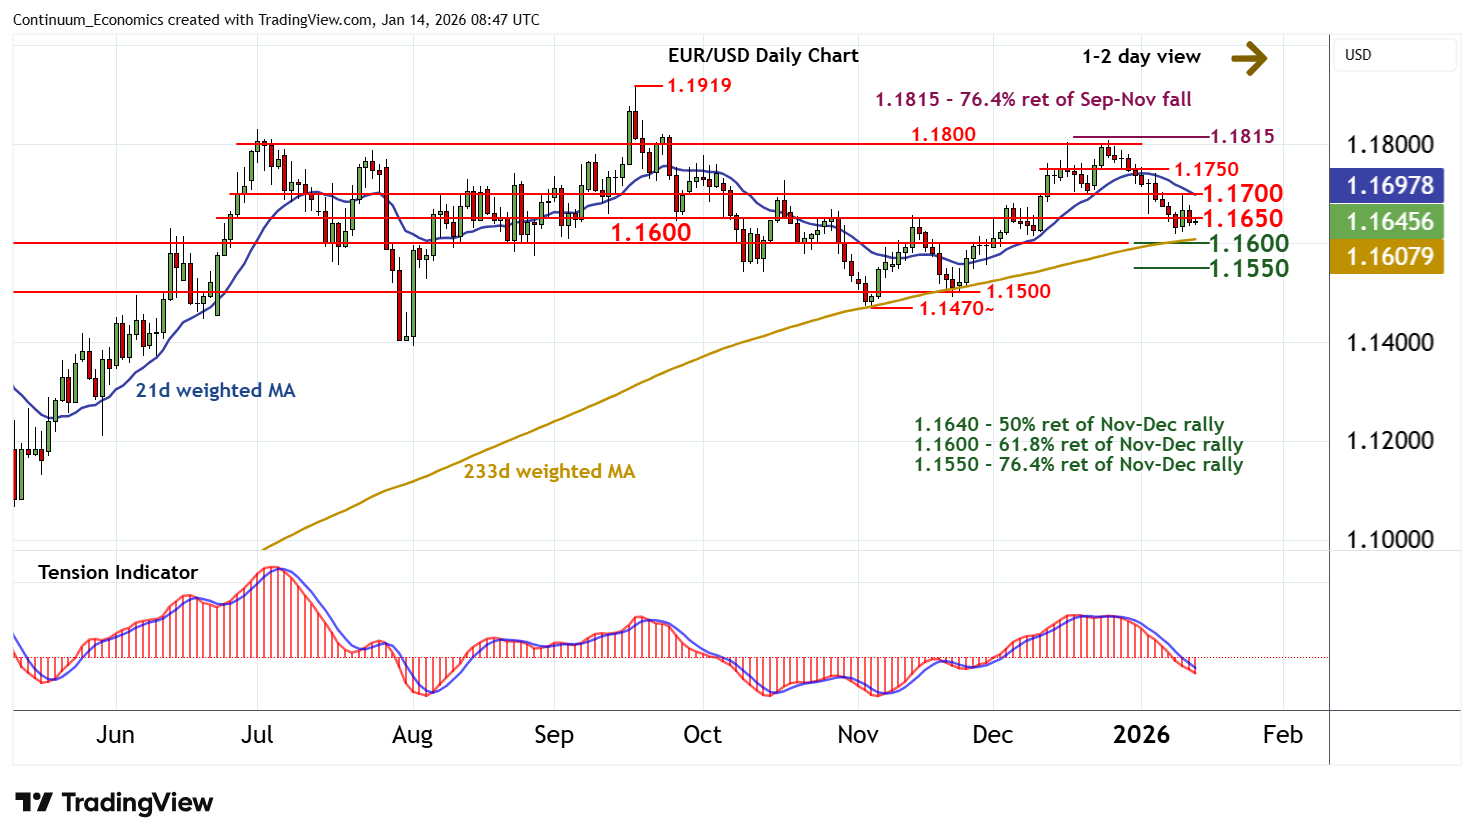
The anticipated break below 1.1650 is currently balanced around 1.1640
| Levels | Imp | Comment | Levels | Imp | Comment | |||
|---|---|---|---|---|---|---|---|---|
| R4 | 1.1800 | * | congestion | S1 | 1.1618 | 9 Jan (w) low | ||
| R3 | 1.1750 | * | congestion | S2 | 1.1600 | ** | congestion, 61.8% ret | |
| R2 | 1.1700 | * | congestion | S3 | 1.1550 | ** | 76.4% ret of Nov-Dec rally | |
| R1 | 1.1650 | * | congestion | S4 | 1.1500 | ** | congestion |
*Asterisk denotes strength of level
08:35 GMT - The anticipated break below 1.1650 is currently balanced around 1.1640, as oversold daily stochastics turn higher. A test back above here is possible. But the bearish daily Tension Indicator and deteriorating weekly charts should limit scope in renewed selling interest beneath further congestion around 1.1700. In the coming sessions, lower levels are looked for, with focus to turn to strong support within the 1.1600/18 range. A close beneath here would add weight to sentiment and extend late-December losses towards the 1.1550 Fibonacci retracement.