Published: 2025-02-21T11:55:43.000Z
Chart USD/ZAR Update: Consolidating - studies under pressure

Senior Technical Strategist
-
The pullback from resistance at the 18.5000 break level has given way to consolidation
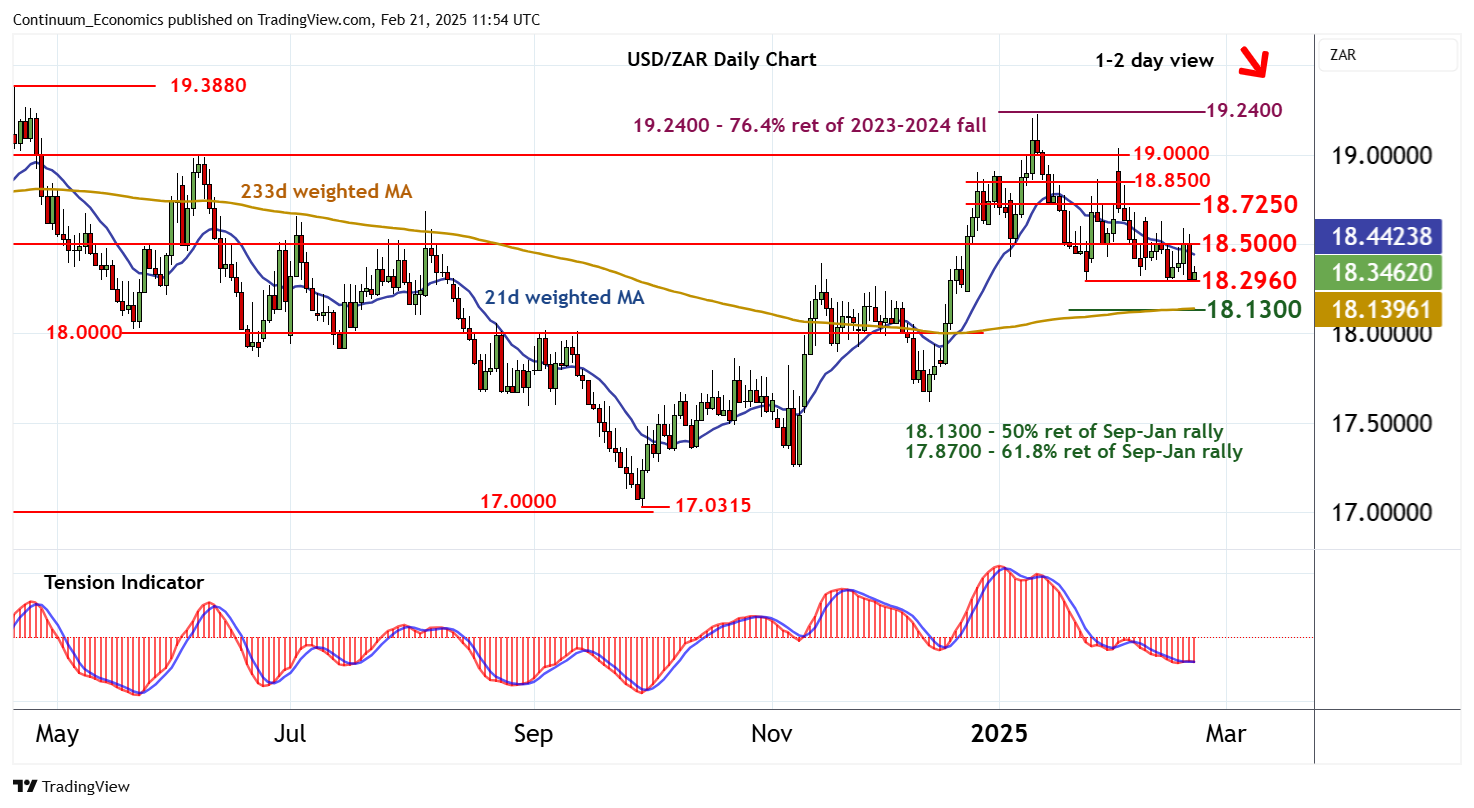
| Level | Comment | Level | Comment | |||||
|---|---|---|---|---|---|---|---|---|
| R4 | 19.0000 | ** | congestion | S1 | 18.2960 | * | 24 Jan YTD low | |
| R3 | 18.8500 | break level | S2 | 18.1300 | * | 50% ret of Sep-Jan rally | ||
| R2 | 18.7250 | * | congestion | S3 | 18.0000 | ** | congestion | |
| R1 | 18.5000 | ** | break level | S4 | 17.8700 | ** | 61.8% ret of Sep-Jan rally |
Asterisk denotes strength of level
11:30 GMT - The pullback from resistance at the 18.5000 break level has given way to consolidation above strong support at the 18.2960 current year low of 24 January. However, both intraday and daily studies are mixed/negative and broader weekly charts are bearish, highlighting room for a later break beneath here. January losses will then extend towards the 18.1300 Fibonacci retracement. But by-then oversold intraday studies could prompt renewed short-covering/consolidation. Meanwhile, any tests above 18.5000 are expected to meet renewed selling interest beneath congestion around 18.7250.