Published: 2026-01-02T09:17:11.000Z
Chart USD Index DXY Update: Cautious trade - daily studies rising
-
Little change, as mixed intraday studies keep near-term sentiment cautious
| Levels | Imp | Comment | Levels | Imp | Comment | |||
|---|---|---|---|---|---|---|---|---|
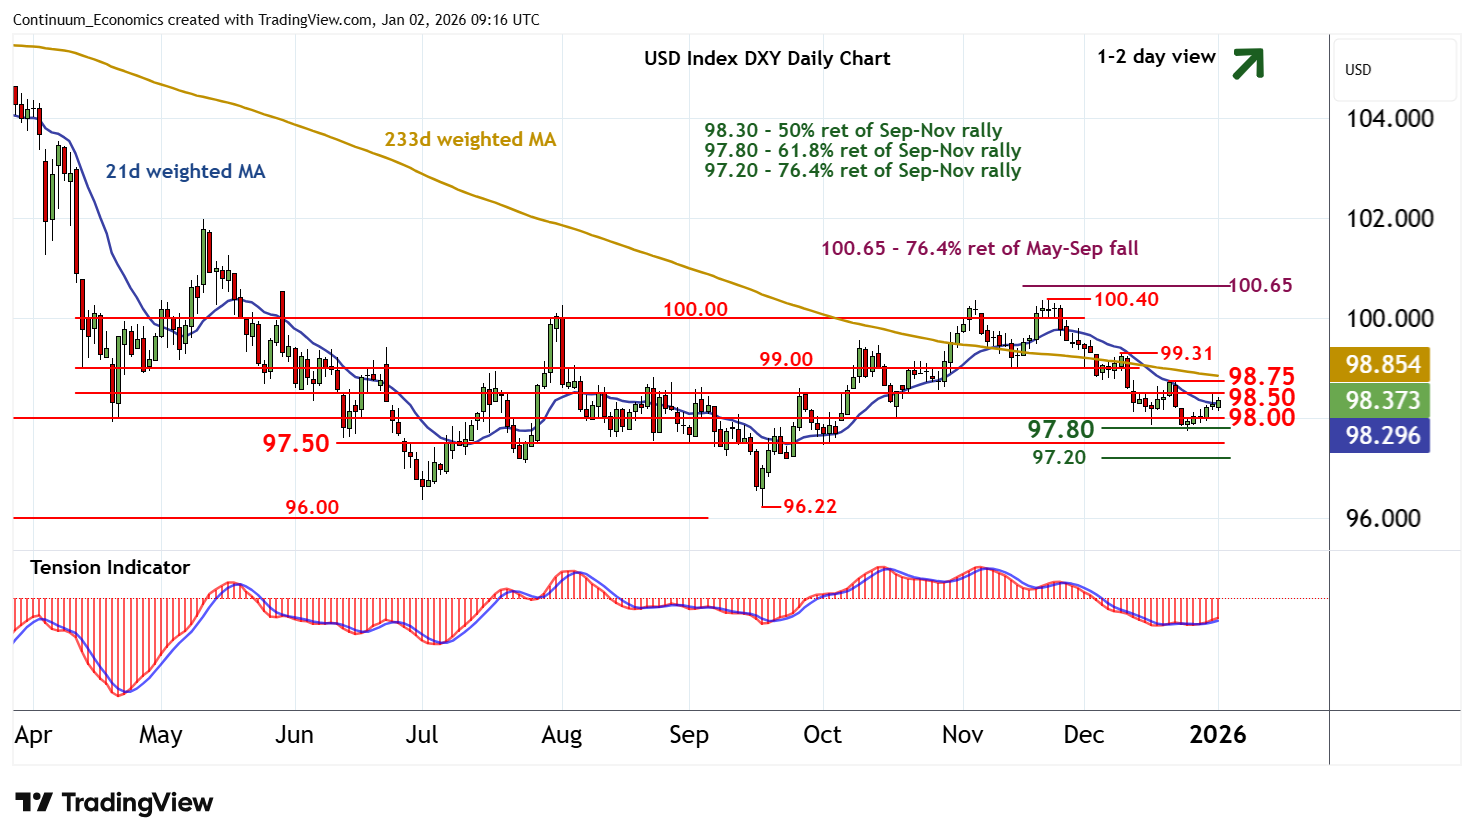
| R4 | 99.31 | * | 9 Dec (w) high | S1 | 98.00 | * | congestion | |
| R3 | 99.00 | * | congestion | S2 | 97.80 | ** | 61.8% ret of Sep-Nov rally | |
| R2 | 98.75 | * | 19 Dec (w) high | S3 | 97.50 | congestion | ||
| R1 | 98.50 | * | congestion | S4 | 97.20 | ** | 76.4% ret of Sep-Nov rally |
Asterisk denotes strength of level
08:55 GMT - Little change, as mixed intraday studies keep near-term sentiment cautious and extend consolidation beneath congestion resistance at 98.50. A tick higher in daily readings highlights room for a test above here. But negative weekly charts are expected to limit initial scope in renewed consolidation beneath the 98.75 weekly high of 19 December. A further close above here, however, would improve sentiment and extend corrective gains towards further congestion around 99.00. Meanwhile, support remains at 98.00 and extends to the 97.80 Fibonacci retracement. This range should underpin any immediate setbacks.