Chart USD/JPY Update: Higher in JPY-driven trade
Sharp JPY-driven gains have reached 157.40
| Levels | Imp | Comment | Levels | Imp | Comment | |||
|---|---|---|---|---|---|---|---|---|
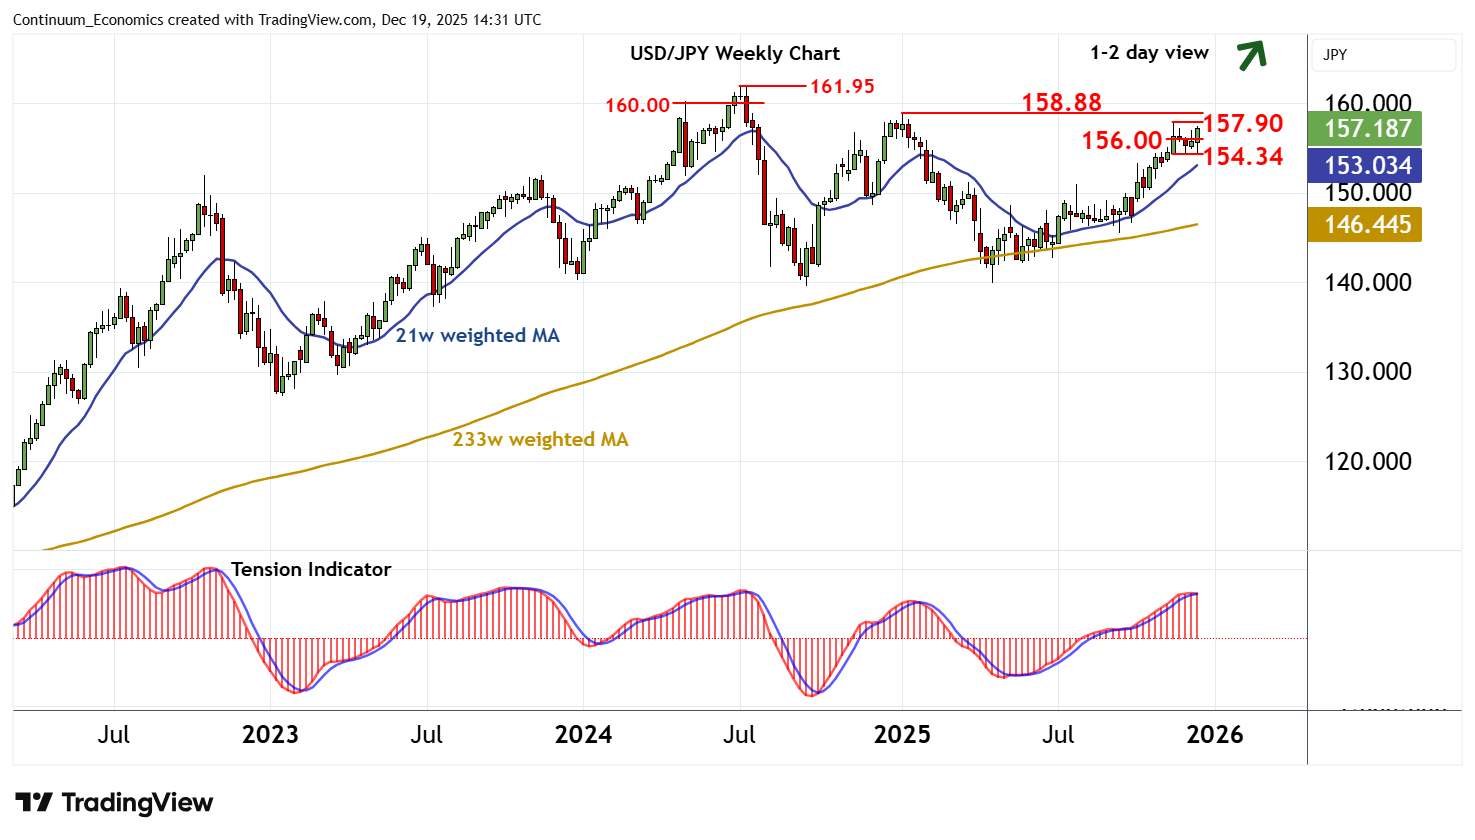
| R4 | 161.95 | ** | July 2024 (y) high | S1 | 157.00 | minor congestion | ||
| R3 | 160.00 | ** | figure | S2 | 156.00 | * | congestion | |
| R2 | 158.88 | ** | 10 Jan YTD high | S3 | 155.00 | * | break level | |
| R1 | 157.90/00 | * | 20 Nov (m) high; break level | S4 | 154.34 | * | 5 Dec (w) low |
Asterisk denotes strength of level
13:55 GMT - Sharp JPY-driven gains have reached 157.40, where flattening overbought intraday studies are prompting short-term reactions. Daily readings are improving and bearish weekly charts are flattening, suggesting room for further strength in the coming sessions. Strong resistance is at the 157.90 monthly high of 20 November and the 158.00 break level. A close above here will improve sentiment and extend April gains towards the 158.88 year high of 10 January. However, already overbought daily stochastics are expected to limit any initial tests in consolidation. Meanwhile, support is down to congestion around 156.00. A close beneath here, if seen, will stabilise price action. But a further close below the 154.34 weekly low of 5 December is needed to turn sentiment negative and confirm continuation of late-November losses.