Published: 2026-01-22T00:40:48.000Z
Chart USD/JPY Update: Consolidating, lower later
1
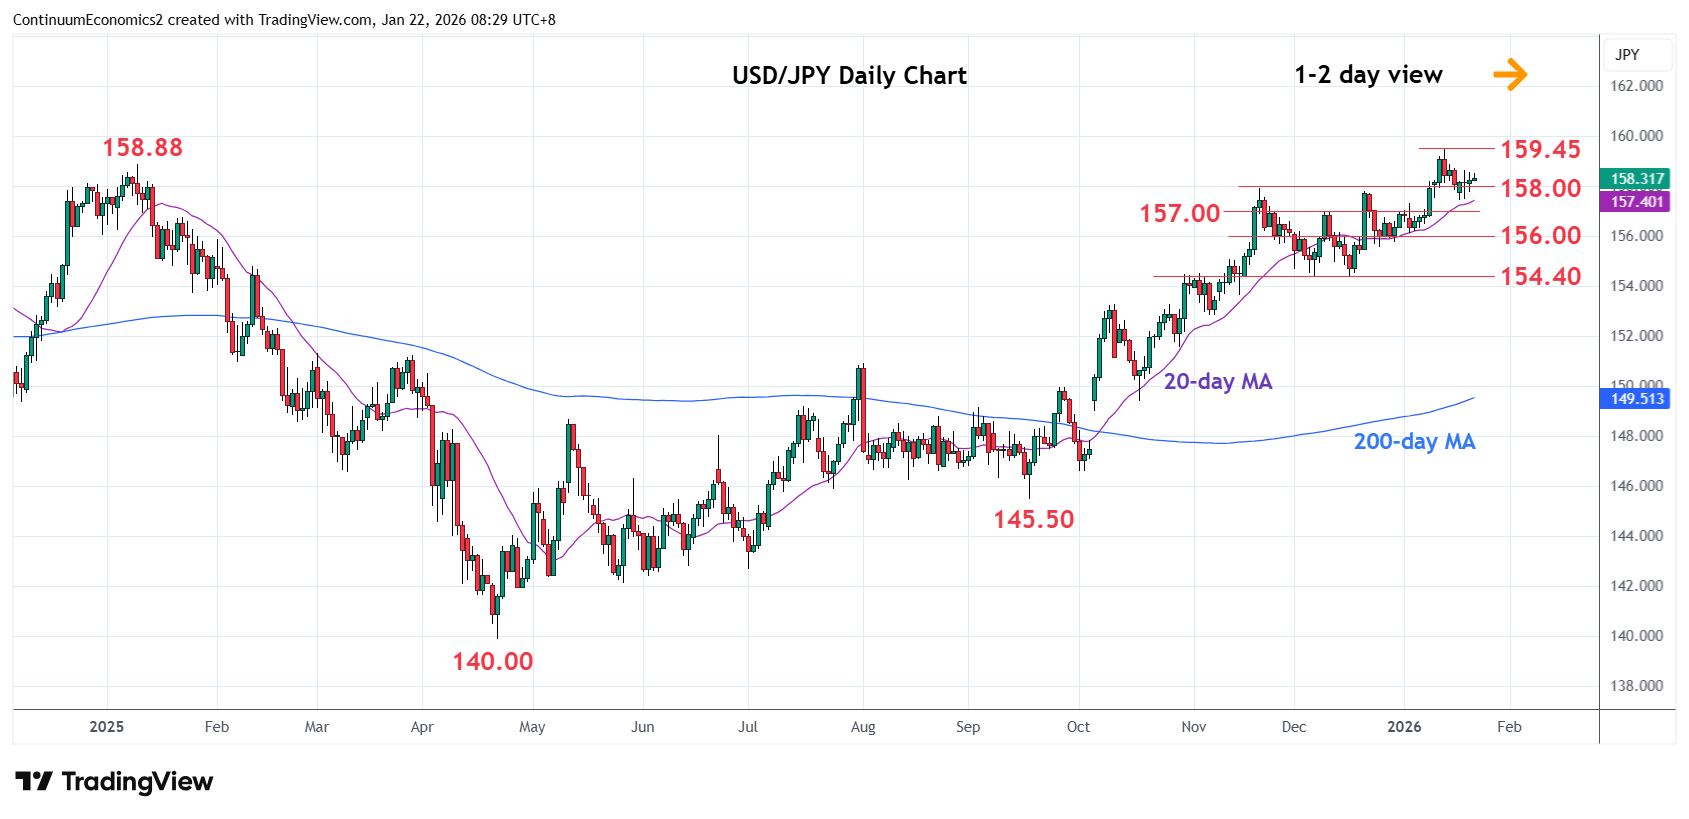
Little change, as prices edged up from the 157.43 low to consolidate losses from the 159.45 high
| Levels | Imp | Comment | Levels | Imp | Comment | |||
|---|---|---|---|---|---|---|---|---|
| R4 | 161.00 | * | congestion | S1 | 157.30 | 5 Jan high | ||
| R3 | 160.00 | * | figure, congestion | S2 | 157.00 | * | congestion | |
| R2 | 159.45 | ** | 14 Jan YTD high | S3 | 156.00 | * | congestion | |
| R1 | 158.88 | * | Jan 2025 year high | S4 | 154.40/35 | ** | Dec lows |
Asterisk denotes strength of level
00:35 GMT - Little change, as prices edged up from the 157.43 low to consolidate losses from the 159.45 high. Negative daily studies suggest consolidation to give way to renewed selling pressure later and see room for deeper pullback to retrace gains from the 154.40, December low. Lower will see room to support at the 157.30/00 area and where break will open up room for deeper pullback to support at the 156.00/155.50 congestion area. Meanwhile, resistance at the 158.88 and 159.45 highs are expected to cap.