Published: 2025-12-09T00:56:16.000Z
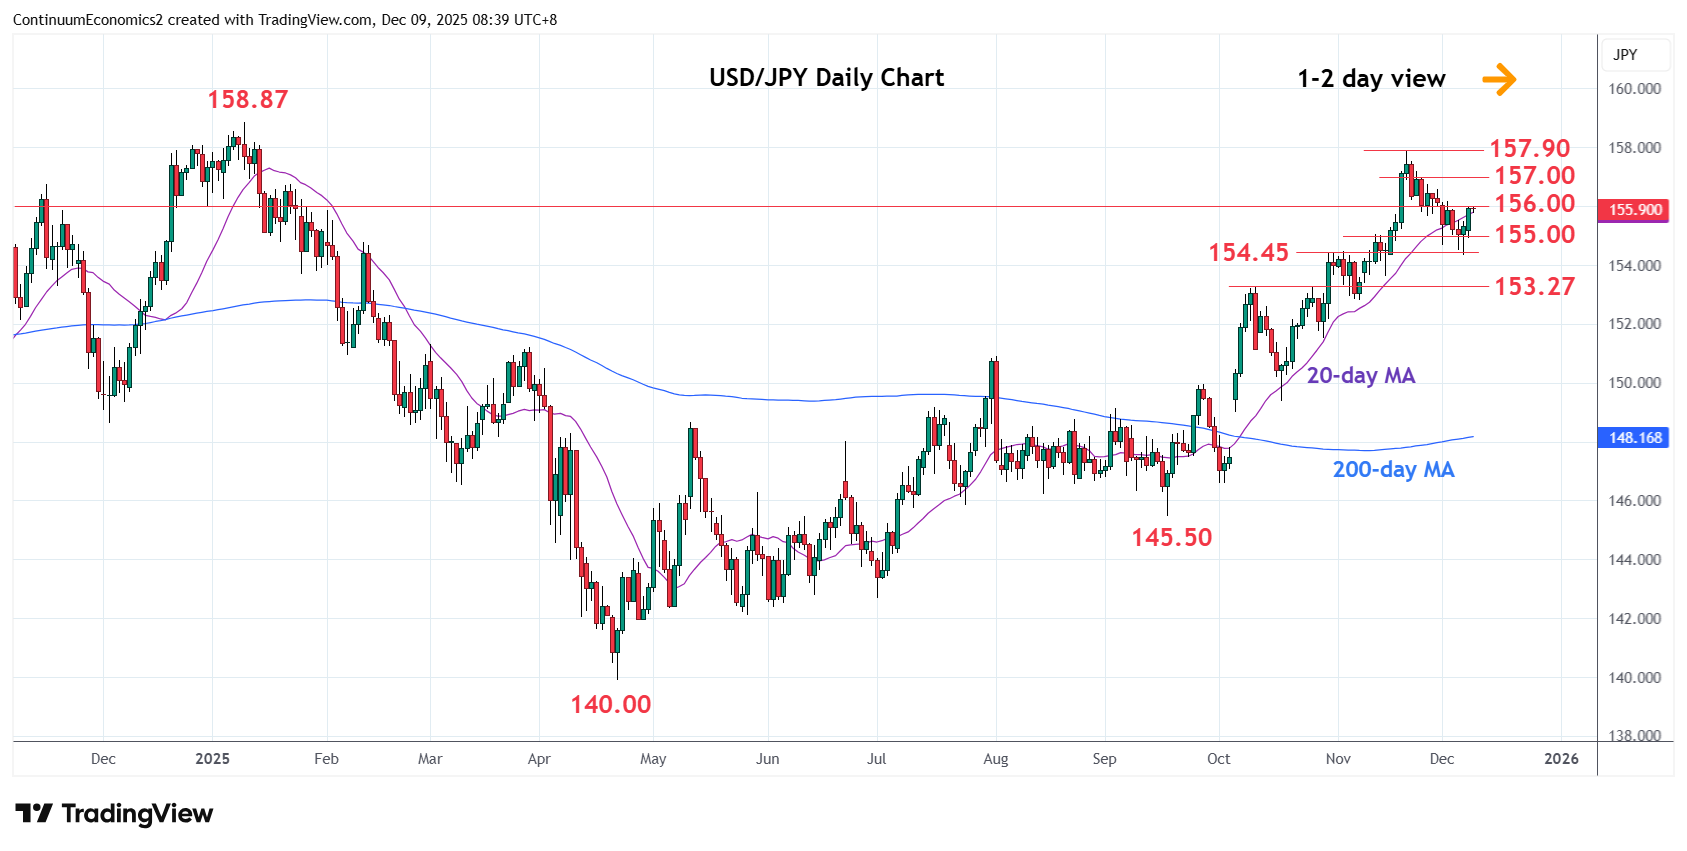
Chart USD/JPY Update: Extend bounce from 155.00/154.45 support
-
Bounce from the 155.00/154.45 support see prices unwinding oversold daily studies to pressure resistance at the 156.00/20 area
| Levels | Imp | Comment | Levels | Imp | Comment | |||
|---|---|---|---|---|---|---|---|---|
| R4 | 158.87 | ** | 10 Jan YTD high | S1 | 155.00 | * | congestion | |
| R3 | 157.90/00 | ** | 20 Nov high, congestion | S2 | 154.45 | ** | 30 Oct high | |
| R2 | 156.70 | * | congestion | S3 | 154.00 | * | congestion | |
| R1 | 156.00/20 | * | congestion | S4 | 153.27 | ** | 10 Oct high |
Asterisk denotes strength of level
00:45 GMT - Bounce from the 155.00/154.45 support see prices unwinding oversold daily studies to pressure resistance at the 156.00/20 area which is expected to cap. Break here, if seen, will open up room for stronger bounce to resistance at the 156.70 congestion. Corrective bounce is expected to give way to renewed selling pressure later to extend losses from the 157.90, November current year high. Break of the 155.00/154.45 support will open up room for deeper pullback to strong support at the 153.27/152.80 area.