Published: 2026-01-30T01:16:59.000Z
Chart EUR/USD Update: Lower in consolidation from 1.2083 high
2
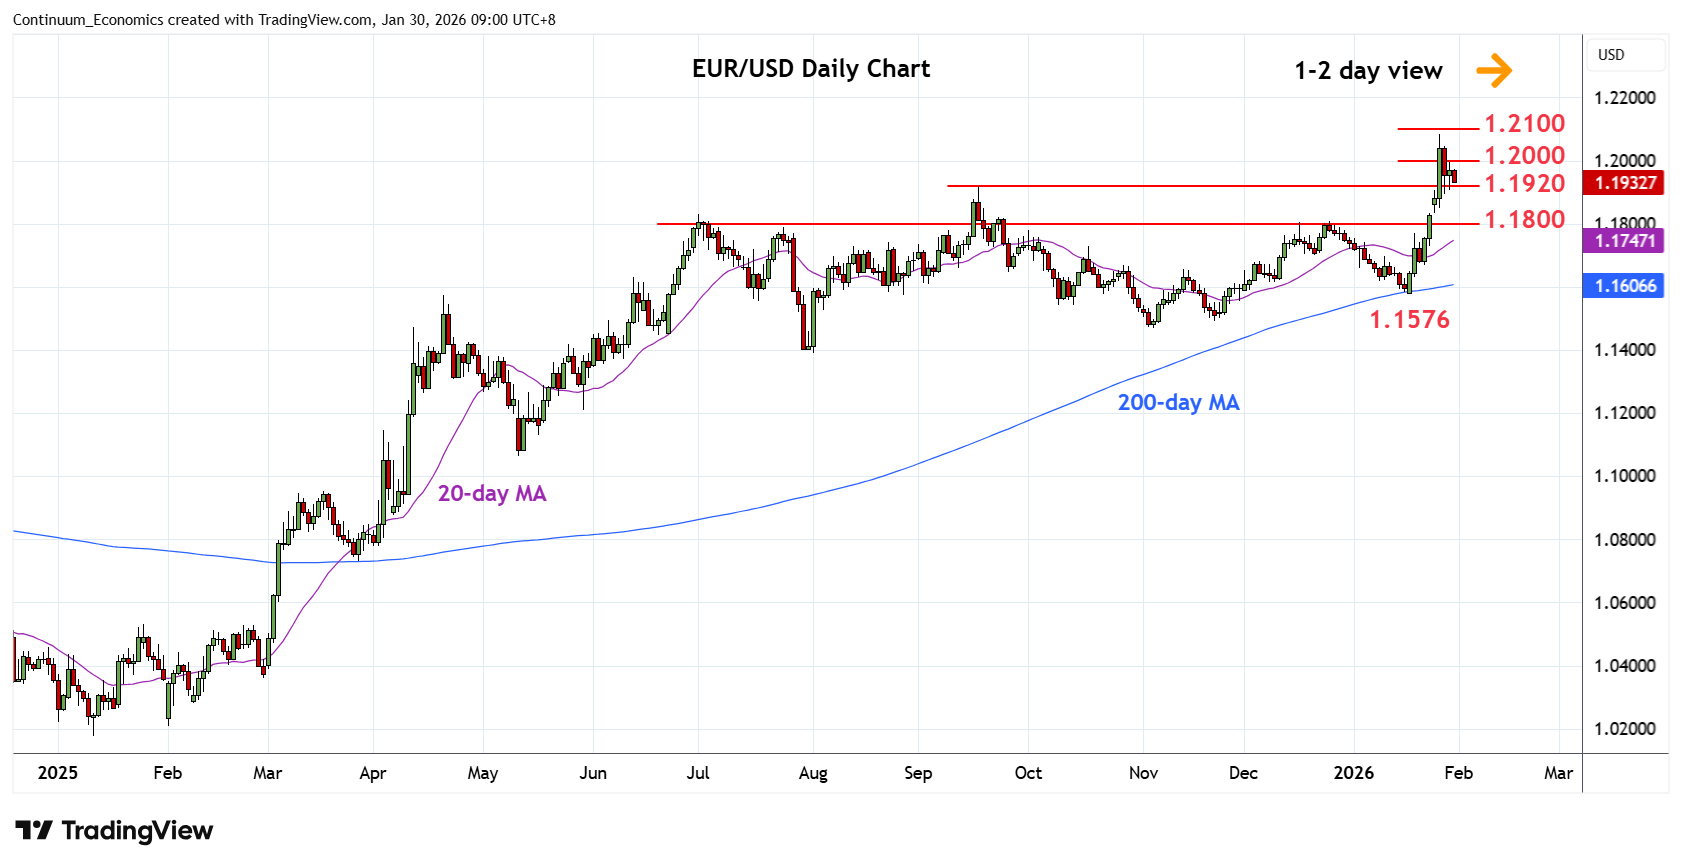
Lower in range from the 1.2083 Tuesday's high as prices unwind overbought intraday and daily studies
| Levels | Imp | Comment | Levels | Imp | Comment | |||
|---|---|---|---|---|---|---|---|---|
| R4 | 1.2266 | ** | May 2021 high | S1 | 1.1920/00 | * | 2025 yr high, congestion | |
| 14 | 1.2200 | * | congestion | S2 | 1.1833 | * | 23 Jan high, gap | |
| R2 | 1.2100/50 | * | congestion | S3 | 1.1800 | ** | congestion | |
| R1 | 1.2083 | ** | 27 Jan YTD high | S4 | 1.1768 | 20 Jan high |
Asterisk denotes strength of level
01:10 GMT - Lower in range from the 1.2083 Tuesday's high as prices unwind overbought intraday and daily studies. Pullback see support starting at the 1.1920/00 area. Break here will open up room for deeper correction of gains from the 1.1576 low of last week to strong support at the 1.1833/1.1800 gap and congestion area. Corrective pullback is expected to give way to fresh gains later and break above 1.2083 high will see room for extension to 1.2100/1.2150 congestion and 1.2200 level. Beyond these will turn focus the 1.2350, 2021 year high.