Chart USD/CAD Update: Leaning lower

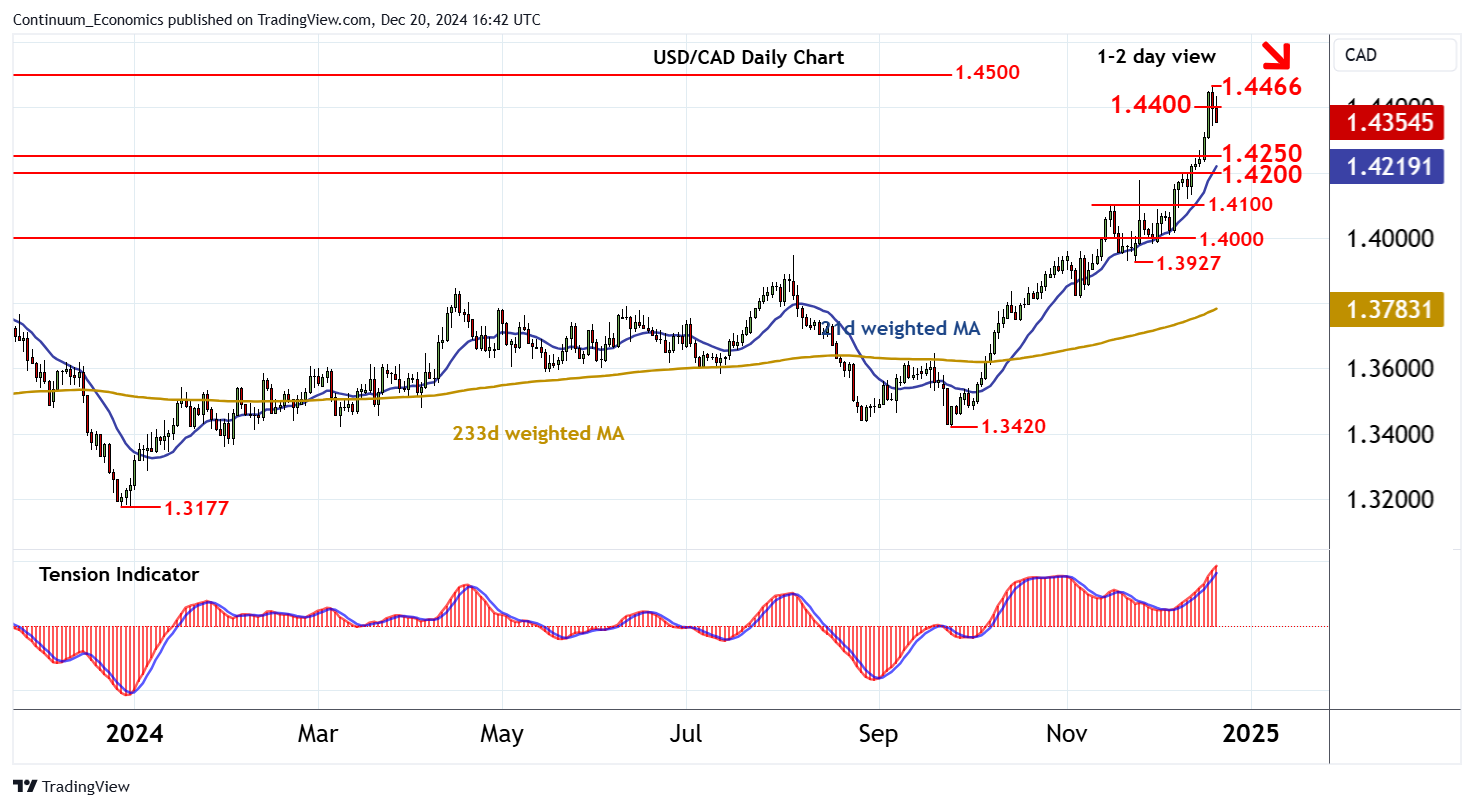
Little change, as the pullback from the 1.4465 current year high of 19 December gives way to choppy trade beneath resistance at 1.4400

| Levels | Imp | Comment | Levels | Imp | Comment | |||
|---|---|---|---|---|---|---|---|---|
| R4 | 1.4560 | * | mid-Mar 2020 (w) high | S1 | 1.4250 | break level | ||
| R3 | 1.4500 | ** | congestion | S2 | 1.4200 | congestion | ||
| R2 | 1.4465~ | * | 19 Dec YTD high | S3 | 1.4100 | * | break level | |
| R1 | 1.4400 | break level | S4 | 1.4000 | * | congestion |
Asterisk denotes strength of level
16:30 GMT - Little change, as the pullback from the 1.4465 current year high of 19 December gives way to choppy trade beneath resistance at 1.4400. Intraday studies are falling and overbought daily stochastics are unwinding, highlighting room for further losses towards support at the 1.4250 break level. However, the rising daily Tension Indicator and improving weekly charts are expected to limit any further losses in renewed buying interest towards congestion around 1.4200. Following cautious trade, fresh gains are looked for. A later break above 1.4465 will open up congestion around 1.4500, with room for continuation towards the 1.4560 weekly high of mid-March 2020.