Published: 2025-11-18T13:02:56.000Z
Chart USD/ZAR Update: Gains to remain limited
1
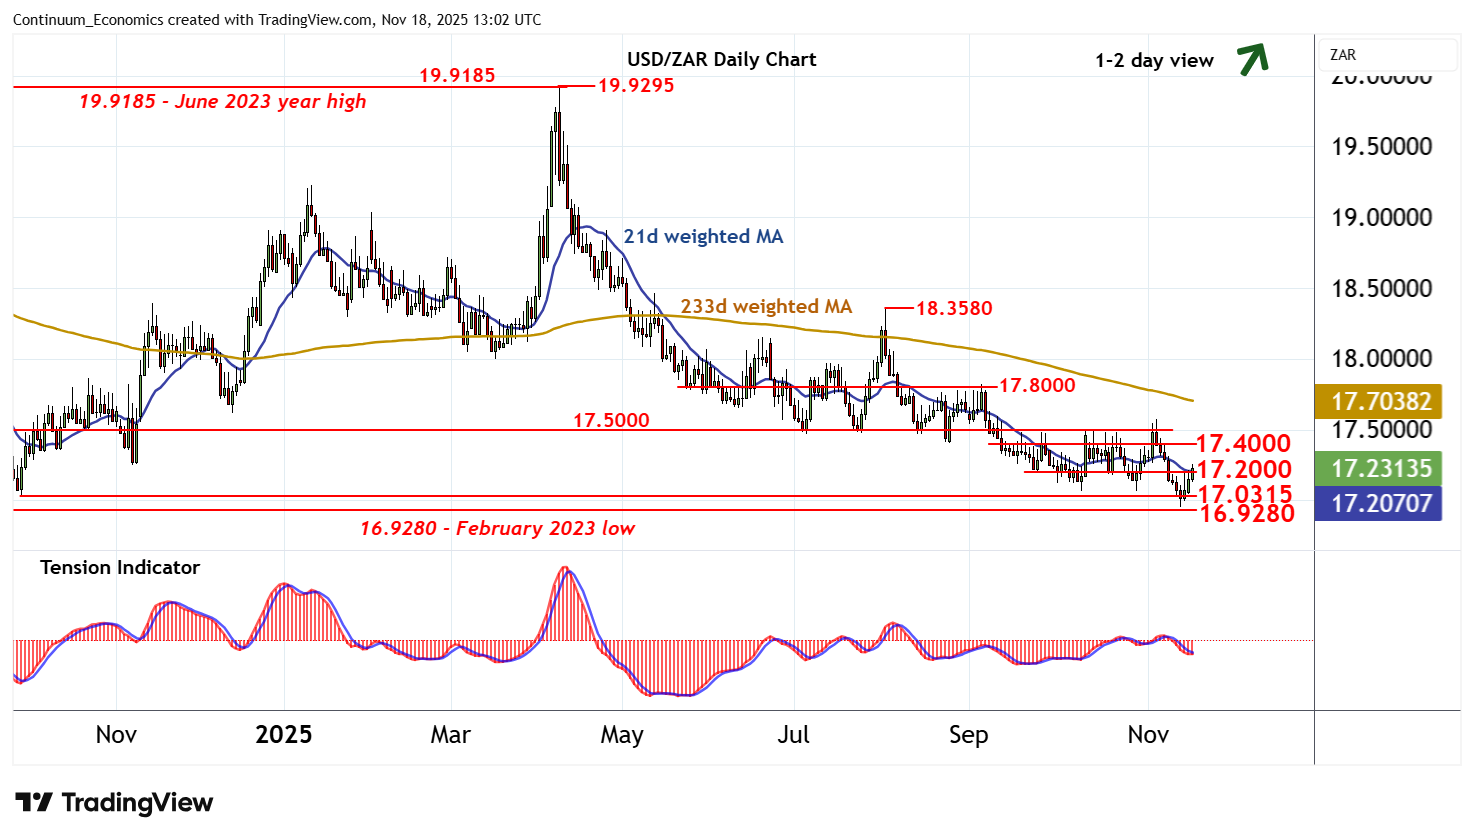
Anticipated gains are currently testing levels just above congestion resistance at 17.2000
| Level | Comment | Level | Comment | |||||
|---|---|---|---|---|---|---|---|---|
| R4 | 17.5625 | ** | 38.2% ret of Aug-Oct fall | S1 | 17.0315 | ** | 30 Sep 2024 (y) low | |
| R3 | 17.5000 | ** | congestion | S2 | 17.0000 | ** | congestion | |
| R2 | 17.4000 | * | congestion | S3 | 16.9495 | ** | 13 Nov YTD low | |
| R1 | 17.2000 | * | congestion | S4 | 16.9280 | February 2023 low |
Asterisk denotes strength of level
12:40GMT - Anticipated gains are currently testing levels just above congestion resistance at 17.2000. Intraday studies are mixed/positive and oversold daily stochastics are unwinding, highlighting room for extension towards further congestion around 17.4000. However, mixed weekly charts are expected to limit any initial tests in renewed selling interest/consolidation. Meanwhile, support remains at the 17.0315 year low of 30 September 2024 and extends to the 16.9495 current year low of 13 November. This range should underpin any immediate setbacks.