Published: 2026-04-15T01:07:51.000Z
Chart USD/JPY Update: Lower in consolidation beneath 160.00
1
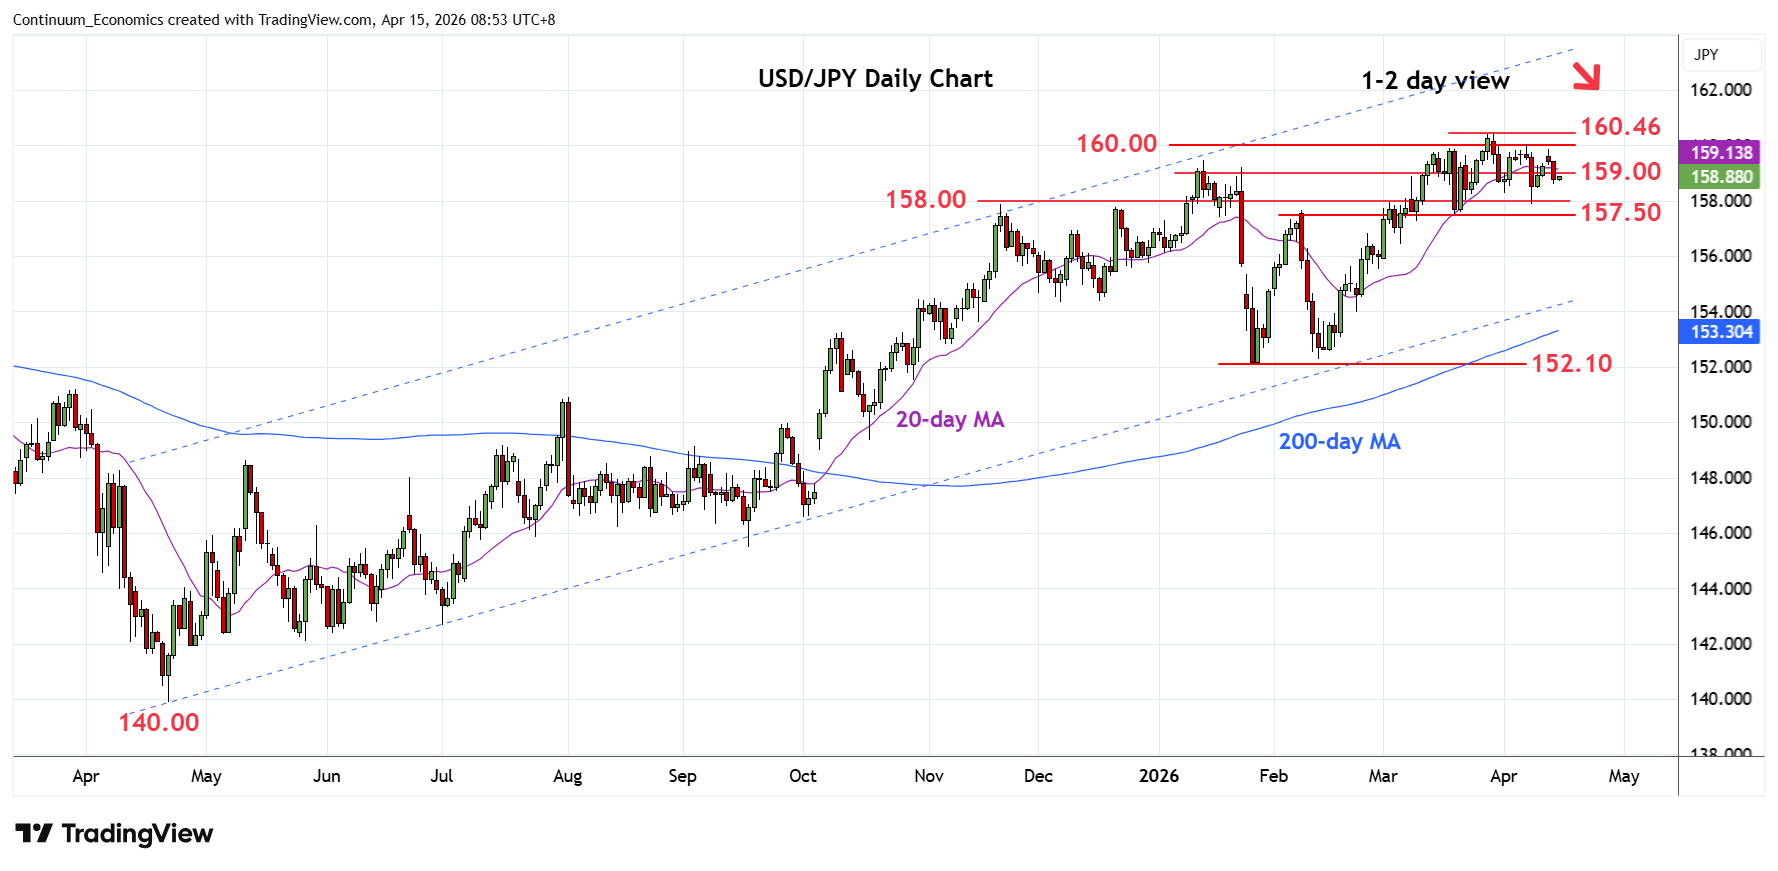
Consolidation beneath the 160.00 figure has given way to break of the 159.00 level to open up room for deeper pullback
| Levels | Imp | Comment | Levels | Imp | Comment | |||
|---|---|---|---|---|---|---|---|---|
| R4 | 161.00 | * | congestion | S1 | 158.27/00 | ** | 1 Apr low, congestion | |
| R3 | 160.46 | ** | 30 Mar YTD high | S2 | 157.50 | ** | 19 Mar low | |
| R2 | 160.00 | ** | figure, congestion | S3 | 157.25 | * | 38.2% Jan/Mar rally | |
| R1 | 159.00 | * | congestion | S4 | 157.00 | congestion |
Asterisk denotes strength of level
01:00 GMT - Consolidation beneath the 160.00 figure has given way to break of the 159.00 level to open up room for deeper pullback to retest strong support at the 158.27/158.00 lows. Below this will expose strong support at 157.50 low of 19 March to retest. Break here will confirm a top in place at the 160.46 high and see room for deeper pullback to retrace gains from the January low. Meanwhile, resistance is lowered to the 159.00 congestion. Above here will see further ranging action beneath the 160.00 figure.