Published: 2026-04-16T01:40:54.000Z
Chart GBP/USD Update: Extend consolidation below 1.3600
2
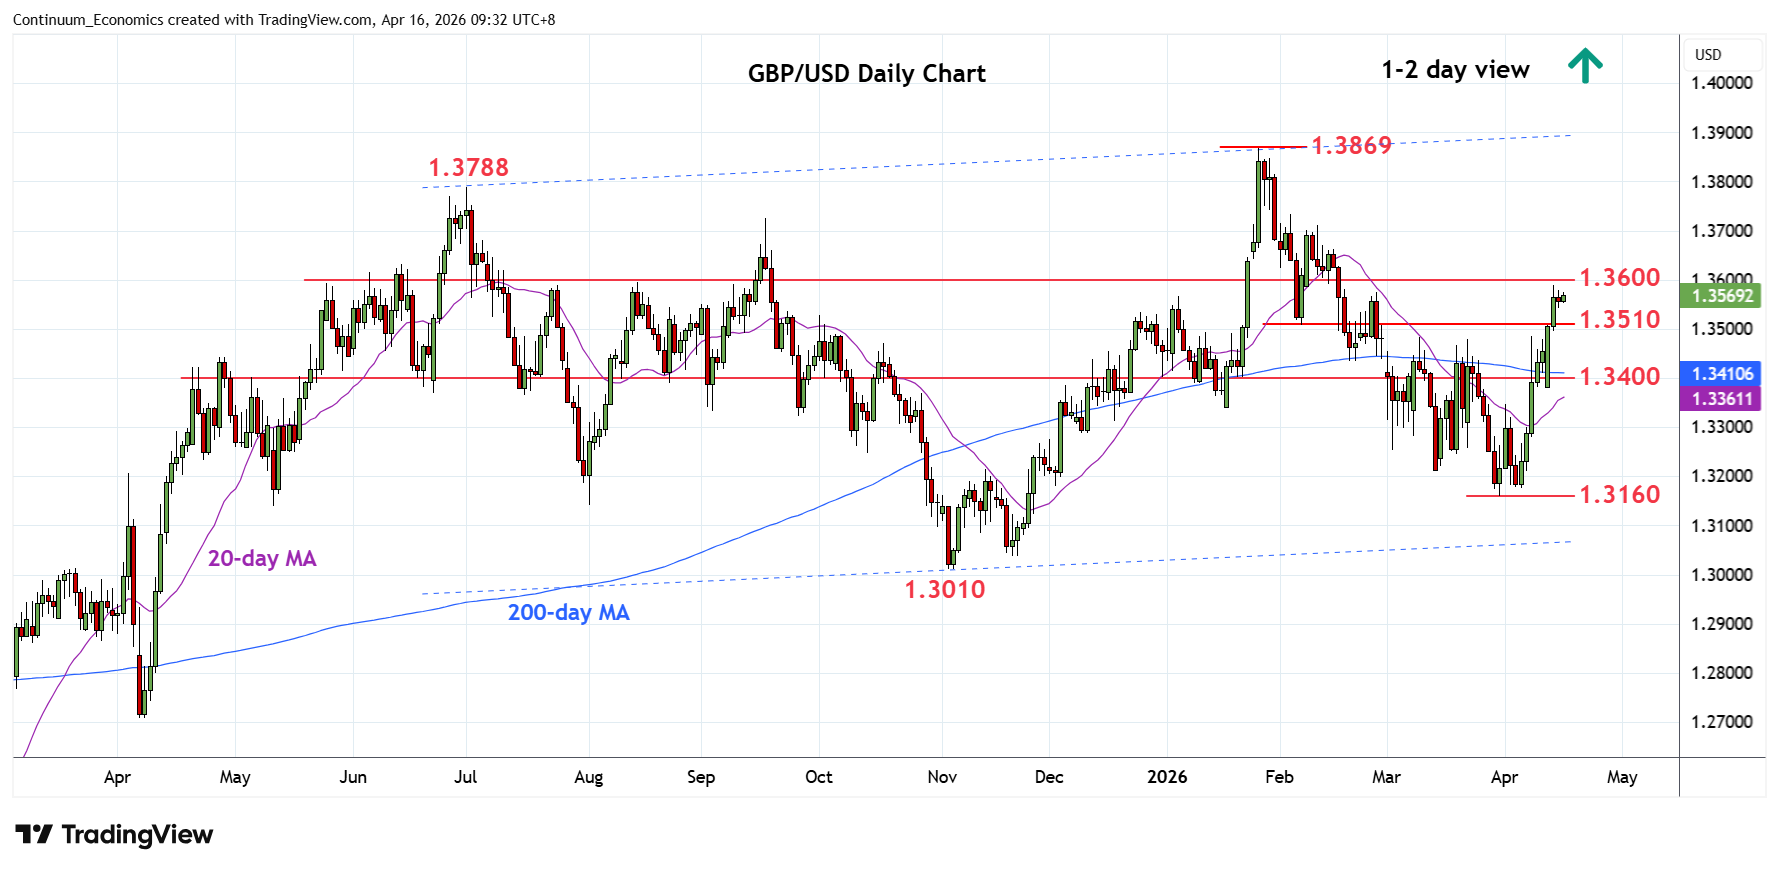
Little change, as prices extend consolidation below the 1.3590 high
| Level | Comment | Level | Comment | |||||
|---|---|---|---|---|---|---|---|---|
| R4 | 1.3788 | ** | Jul 2025 yr high | S1 | 1.3510/00 | * | 6 Feb low, congestion | |
| R3 | 1.3700 | * | congestion, 76.4% | S2 | 1.3480 | * | congestion | |
| R2 | 1.3650 | * | congestion | S3 | 1.3400 | * | congestion | |
| R1 | 1.3600 | * | 61.8% Jan/Mar fall | S4 | 1.3380 | ** | 13 Apr low |
Asterisk denotes strength of level
01:40 GMT - Little change, as prices extend consolidation below the 1.3590 high and unwind overbought intraday studies. Daily studies are stretched as well and caution corrective pullback to support at the 1.3510/00 congestion area and extending to 1.3480 previous highs. This area should underpin and sustain strong gains from the 1.3160, 31 March YTD low. A later break above the 1.3600 level will further retrace the January/March losses and see room to 1.3650/1.3700 area. Beyond this will return focus to 1.3788 and 1.3869, 2025 year high and January YTD high.