Continuum Economics
  • Search
  • About Us
  • Buy
  • Invite A Friend
  • My Basket
  • Articles
  • Calendar
  • Forecasts
  • Events
  • Data
  • Newsletters
  • My Alerts
  • Community
  • Directory
  • About Us
  • Buy
  • Invite A Friend
  • My Basket
  • Articles
    • All
    • Thematic
    • Tactical
    • Asia
    • EMEA
    • Americas
    • Newsletters
    • Freemium
    • Editor's Choice
    • Most Viewed
    • Most Shared
    • Most Liked
  • Calendar
    • Interactive
      • China
      • United States
      • Eurozone
      • United Kingdom
    • Month Ahead
    • Reviews
    • Previews
  • Forecasts
    • Forecasts
    • Key Views
  • Events
    • Media
    • Conference Calls
  • Data
    • Country Insights
    • Shadow Credit Ratings
    • Full CI Data Download
  • Newsletters
  • My Alerts
  • Community
    • FX
    • Fixed Income
    • Macro Strategy
    • Credit Markets
    • Equities
    • Commodities
    • Precious Metals
    • Renewables
  • Directory
  • My Account
  • Notifications Setup
  • Administration Panel
  • Account Details
  • Recent Devices
  • Distribution Lists
  • Shared Free Trials
  • Saved Articles
  • Shared Alerts
  • My Posts
Back
Published: 2026-03-02T02:05:24.000Z

Chart GBP/USD Update: Extending losses
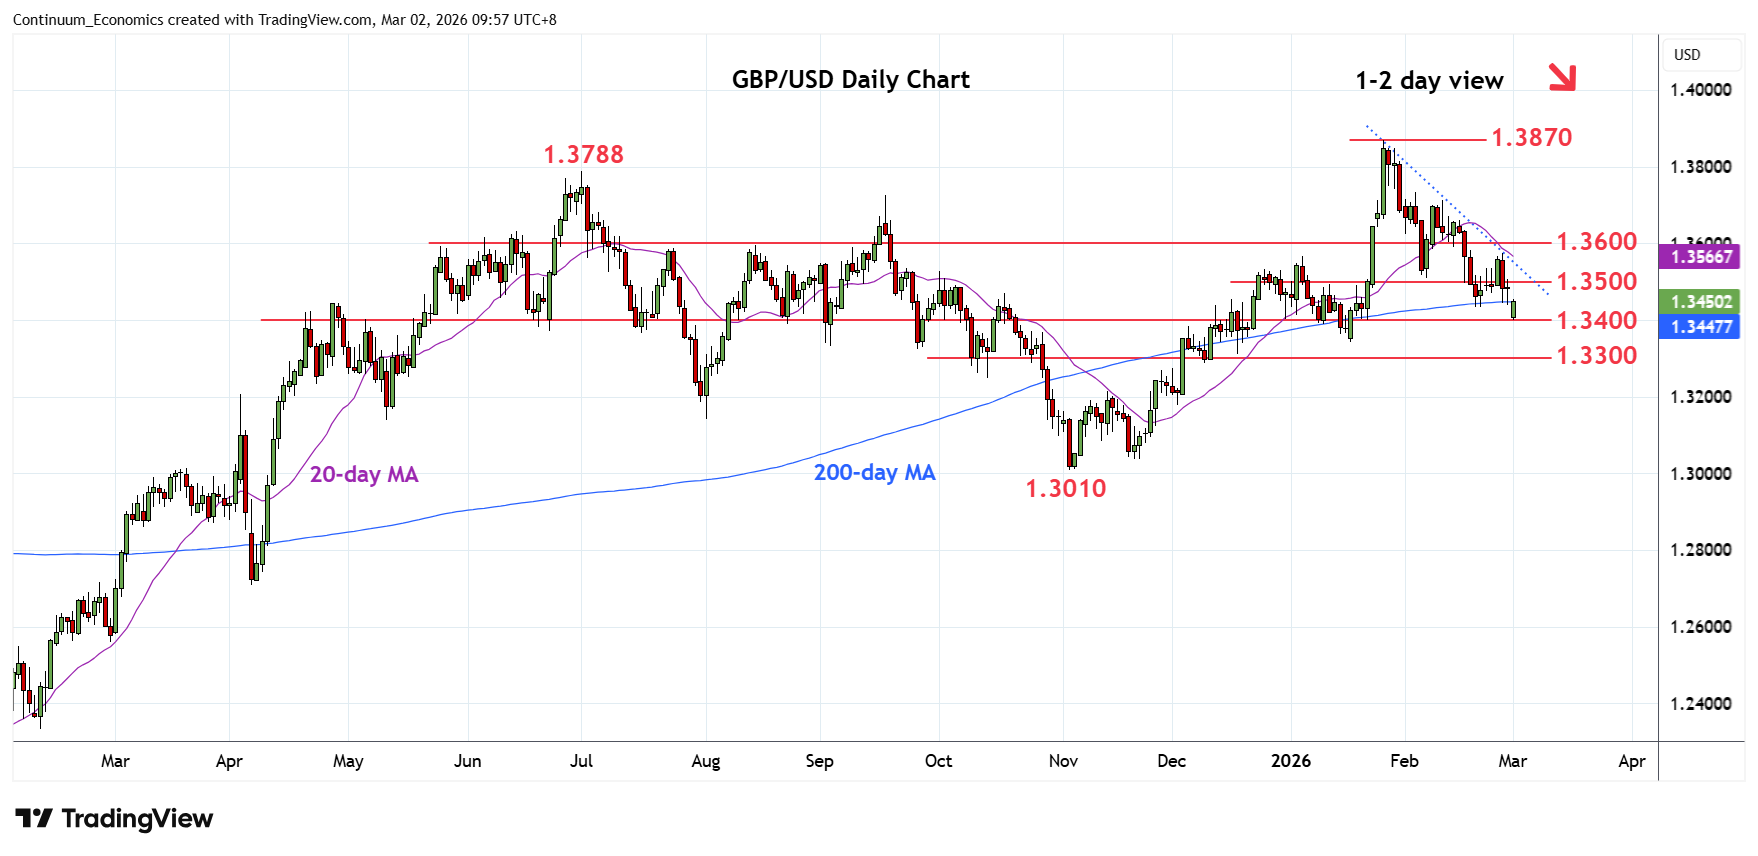
-

 Break of the 1.3440/35 Fibonacci level and 19 February low see prices extending losses from the 1.3870, January current year high

 Level  Comment   Level  Comment 
R4 1.3650*congestion S1 1.3400*congestion
R3 1.3600/20**congestion       S2 1.3340**19 Jan YTD low, 61.8%
R2 1.3575**26 Feb high S3 1.3300*congestion
R1 1.3500*congestion S4 1.3285 9 Dec low

Asterisk denotes strength of level

02:00 GMT - Break of the 1.3440/35 Fibonacci level and 19 February low see prices extending losses from the 1.3870, January current year high. Losses has since stablised at the 1.3400 support as prices unwind oversold intraday studies. However, negative daily and weekly studies suggest risk for break to further extend losses and retrace November/January rally. Lower will see room to 1.3340, January current year low and 61.8% Fibonacci level. Meanwhile, resistance is lowered to the 1.3500 level which is expected to sustain pullback from the 1.3575 high.

Continue to read the article for free
Login

or

or

Topics
GBP/USD-TA
Free-Tactical-TA
DM-Technical
Technical Analysis

GENERAL

  • Home
  • About Us
  • Our Team
  • Careers

LEGAL

  • Terms and Conditions
  • Privacy Policy
  • Compliance
  • GDPR

GET IN TOUCH

  • Contact Us
Continuum Economics
The Technical Analyst Awards Winner 2021
The Technical Analyst Awards Finalist 2020
image