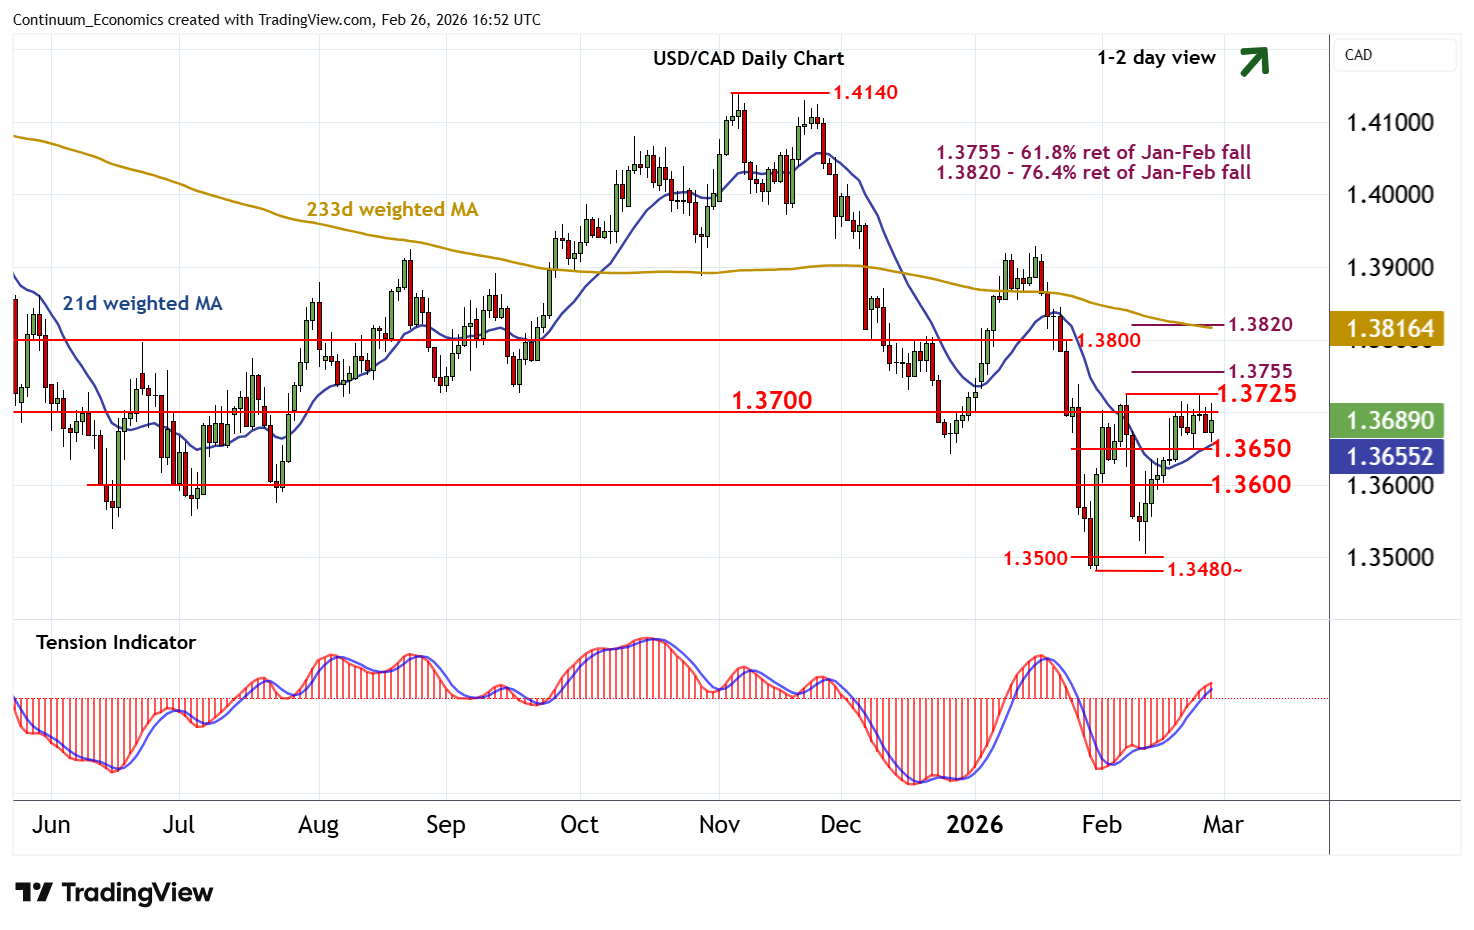
Chart USD/CAD Update: Consolidating - studies improving
Little change, as prices extend consolidation following the retest of resistance at congestion around 1.3700 and the 1.3725 weekly high of 6 February
| Levels | Imp | Comment | Levels | Imp | Comment | |||
|---|---|---|---|---|---|---|---|---|
| R4 | 1.3800 | ** | congestion | S1 | 1.3650 | minor congestion | ||
| R3 | 1.3755 | ** | 61.8% ret of Jan-Feb fall | S2 | 1.3600 | * | congestion | |
| R2 | 1.3725 | * | 6 Feb (w) high | S3 | 1.3500 | ** | congestion | |
| R1 | 1.3700 | * | congestion | S4 | 1.3480~ | ** | 30 Jan YTD low |
Asterisk denotes strength of level
16:35 GMT - Little change, as prices extend consolidation following the retest of resistance at congestion around 1.3700 and the 1.3725 weekly high of 6 February. The daily Tension Indicator continues to rise, highlighting potential for a test above here, with focus to then turn to the 1.3755 Fibonacci retracement. However, flat overbought daily stochastics and mixed weekly charts could limit any initial tests in consolidation. Meanwhile, support remains at congestion around 1.3650. A break beneath here, if seen, should give way to consolidation above further congestion around 1.3600.