Published: 2025-12-19T09:05:11.000Z
Chart USD Index DXY Update: Room for a test higher
-
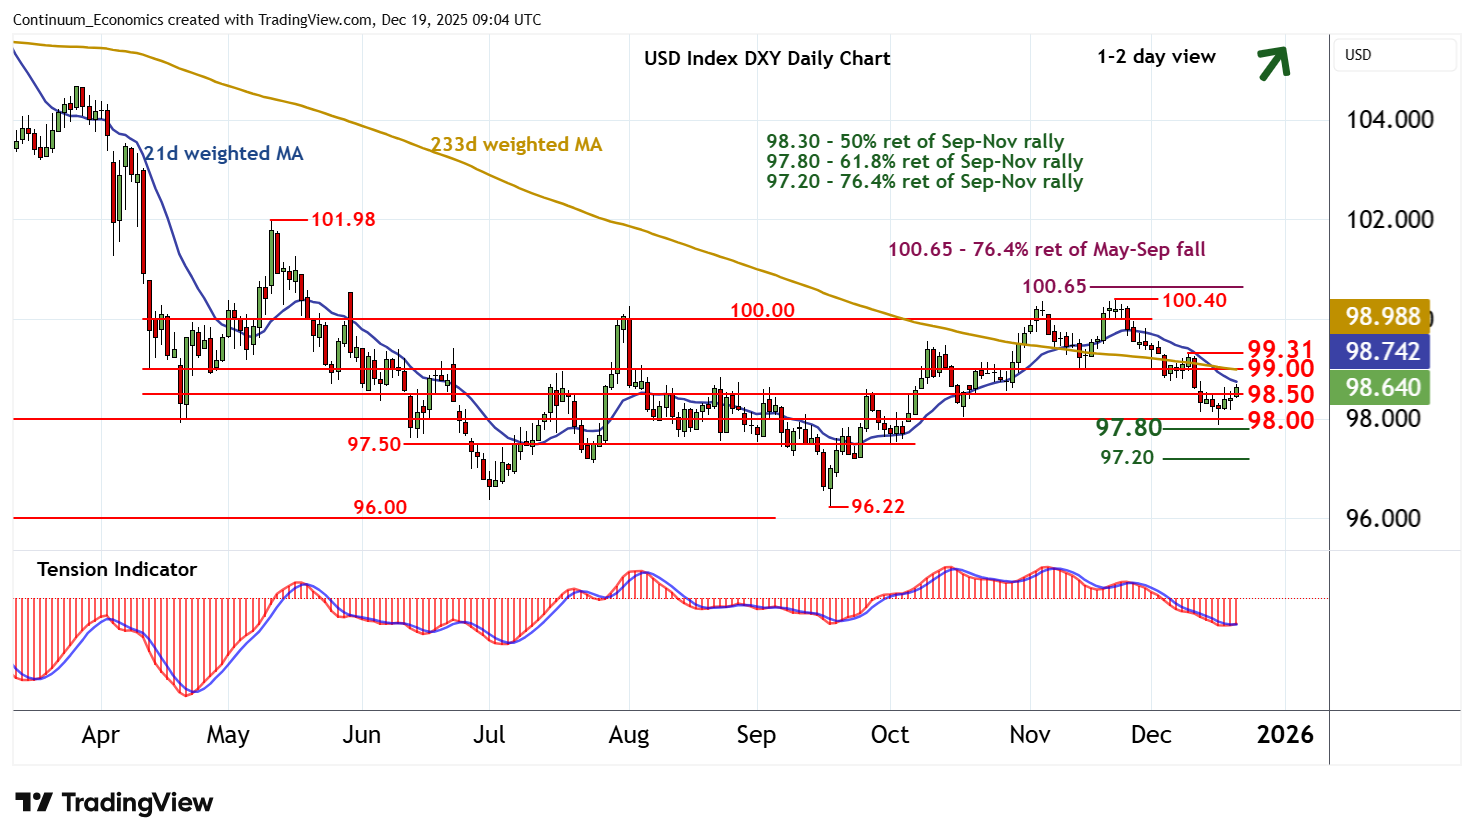
The anticipated break above 98.50 has reached 98.70~
| Levels | Imp | Comment | Levels | Imp | Comment | |||
|---|---|---|---|---|---|---|---|---|
| R4 | 100.00 | ** | congestion | S1 | 98.50 | * | congestion | |
| R3 | 99.50 | * | break level | S2 | 98.00 | * | congestion | |
| R2 | 99.31 | * | 9 Dec (w) high | S3 | 97.80 | ** | 61.8% ret of Sep-Nov rally | |
| R1 | 99.00 | * | congestion | S4 | 97.50 | congestion |
Asterisk denotes strength of level
08:55 GMT - The anticipated break above 98.50 has reached 98.70~, where short-term consolidation is developing. Daily readings are improving, highlighting room for continuation towards congestion around 99.00. But negative weekly charts are expected to limit any immediate break above here in renewed selling interest/consolidation beneath the 99.31 weekly high of 9 December. A close above here, if seen, would improve sentiment and extend mid-December gains towards 100.00. Meanwhile, support at the 97.80 Fibonacci retracement and congestion around 98.00 should underpin any immediate tests below 98.50.